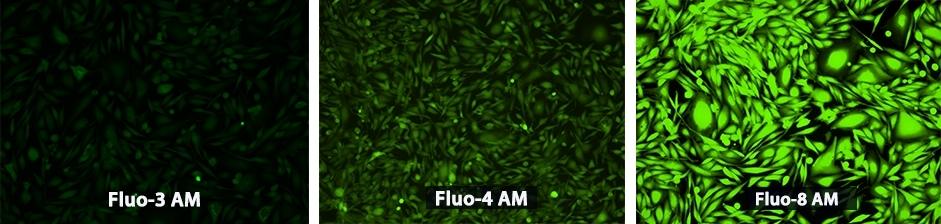
Figure 1. U2OS cells were seeded overnight at 40,000 cells/100 µL/well in a 96-well black wall/clear bottom costar plate. The growth medium was removed, and the cells were incubated with, respectively, 100 µL of Fluo-3 AM, Fluo-4 AM and Fluo-8® AM in HHBS at a concentration of 4 uM in a 37 °C, 5% CO2 incubator for 1 hour. The cells were washed twice with 200 µL HHBS, then imaged with a fluorescence microscope (Olympus IX71) using FITC channel.

Figure 2. Difference in fluorescence intensity of insect flexion leg muscles of the control beetle and the beetle after oral dosing with chemical indicators. (A) Fluo-8; (B) Rhodamine 123; (C) DiBAC4(3); (D) Rhodamine B; and (E) Cell Tracker. The Fluo-8, Rhodamine 123, and DiBAC4(3) dosed beetle leg was observed under 460–480 nm excitation light and fluorescence emitted was collected within 495–540 nm. The Rhodamine B and Cell Tracker dosed beetle leg was observed under 535–555 nm excitation light and fluorescence emitted was collected within 570–625 nm. Fluorescence intensity was measured at the 2 regions of interest (ROIs) shown in S1A Fig. The images obtained were digitized by ImageJ software, and the averaged intensity is shown in each bar graph. The graphs in the right column show the fluorescence intensities of each beetle leg dosed with different chemical indicators (center) compared with the control (left) beetle leg. The control beetles were fed with the home-made jelly (no chemical indicator added) for 2 days prior to observation. The error bars represent the standard deviation (S.D.) (N = 5 beetles, n = 30 beetle legs for control, DiBAC4(3), Rhodamine B, and Rhodamine 123; N = 9 beetles, n = 30 beetle legs for Fluo-8 and Cell Tracker). Each data set was compared with control leg data set by student’s t-test (Fluo-8, p = 1.42×10⁻⁴; Rhodamine 123, p = 4.65×10⁻⁵; DiBAC4(3), p = 6.26×10⁻⁹; Rhodamine B, p = 1.15×10⁻⁹ and Cell Tracker, p = 7.10×10⁻³). The color scale is given on the bottom left corner of the image. The increase in fluorescence intensity for the chemical indicator-dosed beetle compared with the control beetle indicates that the oral dosing method successfully administers and delivers various chemical indicators in order to label the beetle leg muscle. Source: Graph from Oral Dosing of Chemical Indicators for In Vivo Monitoring of Ca2+ Dynamics in Insect Muscle by Ferdinandus et al., PLOS, Jan. 2015.

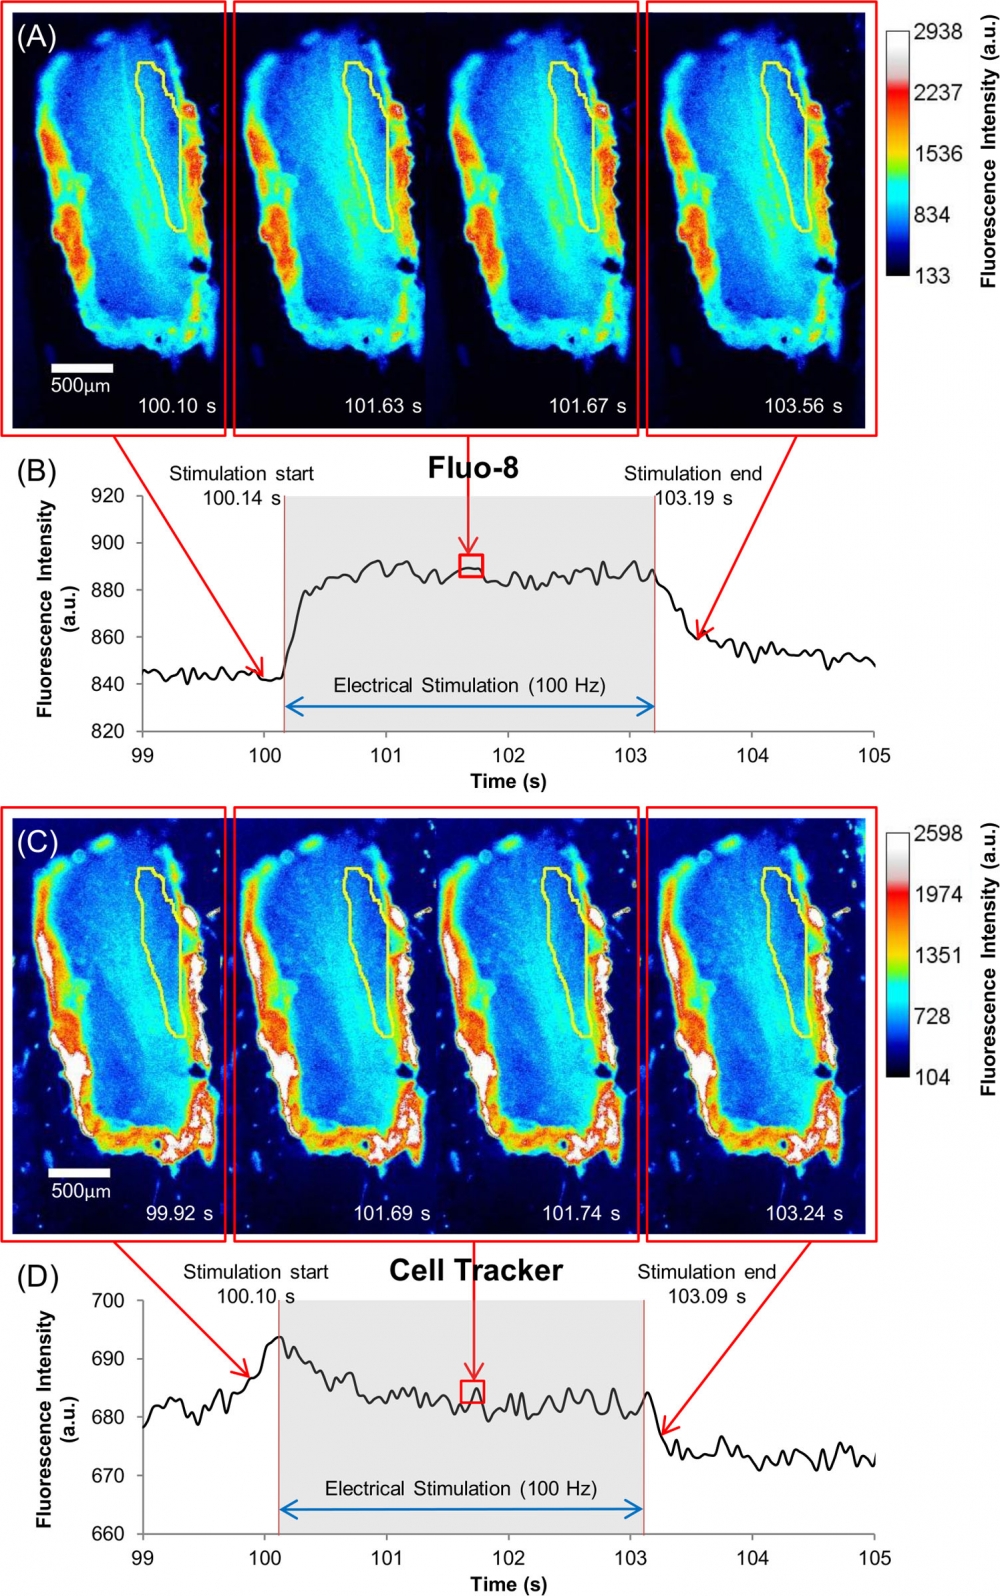
Figure 3. Ca2+ dynamics and muscle displacement of the beetle leg muscle under electrical stimulation with multiple pulse trains (100 Hz, 10% duty cycle, 2 V) for 3 s. Pseudocolor time series images of beetle leg muscle dosed with (A) Fluo-8 (60 µM) and (C) Cell Tracker (60 µM) indicators. ROIs are indicated by yellow region (as also shown in S1B Fig.). The color scale is given on the right side of each image (A) or (C) respectively. Fluorescence intensity dynamics of (B) Fluo-8 and (D) Cell Tracker under electrical stimulation, digitized with ImageJ software from the ROI shown in (A) and (C) respectively. The stimulus timing is indicated by grey shading. The Fluo-8 pseudocolor images illustrate the fluorescence intensity dynamics that correspond to the Ca2+ dynamics inside the leg muscle: it increased at the start of electrical stimulation, was maintained during the application of the stimulus, and finally slowly decreased after the stimulus stopped. The Cell Tracker pseudocolor images display that the muscle displacement also causes intensity change during electrical stimulation, which slightly affects the Fluo-8 measurement. Source: Graph from Oral Dosing of Chemical Indicators for In Vivo Monitoring of Ca2+ Dynamics in Insect Muscle by Ferdinandus et al., PLOS, Jan. 2015.
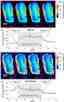
![Relationship of Ca<sup>2+</sup> dynamics with electrical stimulation frequency. Relative changes in fluorescence intensity ((ΔF/F0)×100%) for leg muscle of (A) beetle orally dosed with Fluo-8 (blue) and Cell Tracker (red) and (B) control beetle measured with the filter setting used for Fluo-8 (blue) and Cell Tracker (red) under varying electrical stimulations (1 Hz, 10 Hz, 50 Hz, and 100 Hz; 10% duty cycle; 2 V). Data were analyzed from the ROI adjacent to the stimulated site (S1B Fig.). The error bars represent the S.D. (N = 8 beetles, n = 24 beetle legs for (A); N = 2 beetles, n = 8 beetle legs for (B)). The small numbers next to each plot indicate the order of stimulation. Cell Tracker data set was compared with Fluo-8 data set at each stimulation frequency evaluated by student’s t-test both for dosed beetles in (A) (1st 50 Hz, p = 9.37×10⁻⁴; 10 Hz, p = 7.45×10⁻³; 1st 1 Hz, p = 2.30×10⁻¹; 100 Hz, p = 4.17×10⁻⁴; 2nd 1 Hz, p = 4.49×10⁻²; and 2nd 50 Hz, p = 8.16×10⁻³) and for control beetles in (B) (1st 50 Hz, p = 4.10×10⁻¹; 10 Hz, p = 9.30×10⁻¹; 1st 1 Hz, p = 9.29×10⁻¹; 100 Hz, p = 5.69×10⁻²; 2nd 1 Hz, p = 6.85×10⁻¹; and 2nd 50 Hz, p = 2.67×10⁻²). The significant differences are displayed by an asterisk (p < 0.05). Fluo-8 intensity dynamics show that Ca<sup>2+</sup> dynamics inside the muscle have a positive correlation with electrical stimulation frequency; i.e., higher stimulation frequency induces larger increase in [Ca<sup>2+</sup>]. On the other hand, Cell Tracker intensity dynamics show that the frequency-dependent intensity change due to muscle displacement is not apparent. Source: Graph from <strong>Oral Dosing of Chemical Indicators for <em>In Vivo</em> Monitoring of Ca<sup>2+</sup> Dynamics in Insect Muscle</strong> by Ferdinandus et al., <em>PLOS</em>, Jan. 2015.](/_next/image?url=https%3A%2F%2Fimages.aatbio.com%2Fproducts%2Ffigures-and-data%2Ffluo-8-am%2Ffigure-for-fluo-8-am_EQOEG.jpg&w=3840&q=75)
Figure 4. Relationship of Ca2+ dynamics with electrical stimulation frequency. Relative changes in fluorescence intensity ((ΔF/F0)×100%) for leg muscle of (A) beetle orally dosed with Fluo-8 (blue) and Cell Tracker (red) and (B) control beetle measured with the filter setting used for Fluo-8 (blue) and Cell Tracker (red) under varying electrical stimulations (1 Hz, 10 Hz, 50 Hz, and 100 Hz; 10% duty cycle; 2 V). Data were analyzed from the ROI adjacent to the stimulated site (S1B Fig.). The error bars represent the S.D. (N = 8 beetles, n = 24 beetle legs for (A); N = 2 beetles, n = 8 beetle legs for (B)). The small numbers next to each plot indicate the order of stimulation. Cell Tracker data set was compared with Fluo-8 data set at each stimulation frequency evaluated by student’s t-test both for dosed beetles in (A) (1st 50 Hz, p = 9.37×10⁻⁴; 10 Hz, p = 7.45×10⁻³; 1st 1 Hz, p = 2.30×10⁻¹; 100 Hz, p = 4.17×10⁻⁴; 2nd 1 Hz, p = 4.49×10⁻²; and 2nd 50 Hz, p = 8.16×10⁻³) and for control beetles in (B) (1st 50 Hz, p = 4.10×10⁻¹; 10 Hz, p = 9.30×10⁻¹; 1st 1 Hz, p = 9.29×10⁻¹; 100 Hz, p = 5.69×10⁻²; 2nd 1 Hz, p = 6.85×10⁻¹; and 2nd 50 Hz, p = 2.67×10⁻²). The significant differences are displayed by an asterisk (p < 0.05). Fluo-8 intensity dynamics show that Ca2+ dynamics inside the muscle have a positive correlation with electrical stimulation frequency; i.e., higher stimulation frequency induces larger increase in [Ca2+]. On the other hand, Cell Tracker intensity dynamics show that the frequency-dependent intensity change due to muscle displacement is not apparent. Source: Graph from Oral Dosing of Chemical Indicators for In Vivo Monitoring of Ca2+ Dynamics in Insect Muscle by Ferdinandus et al., PLOS, Jan. 2015.
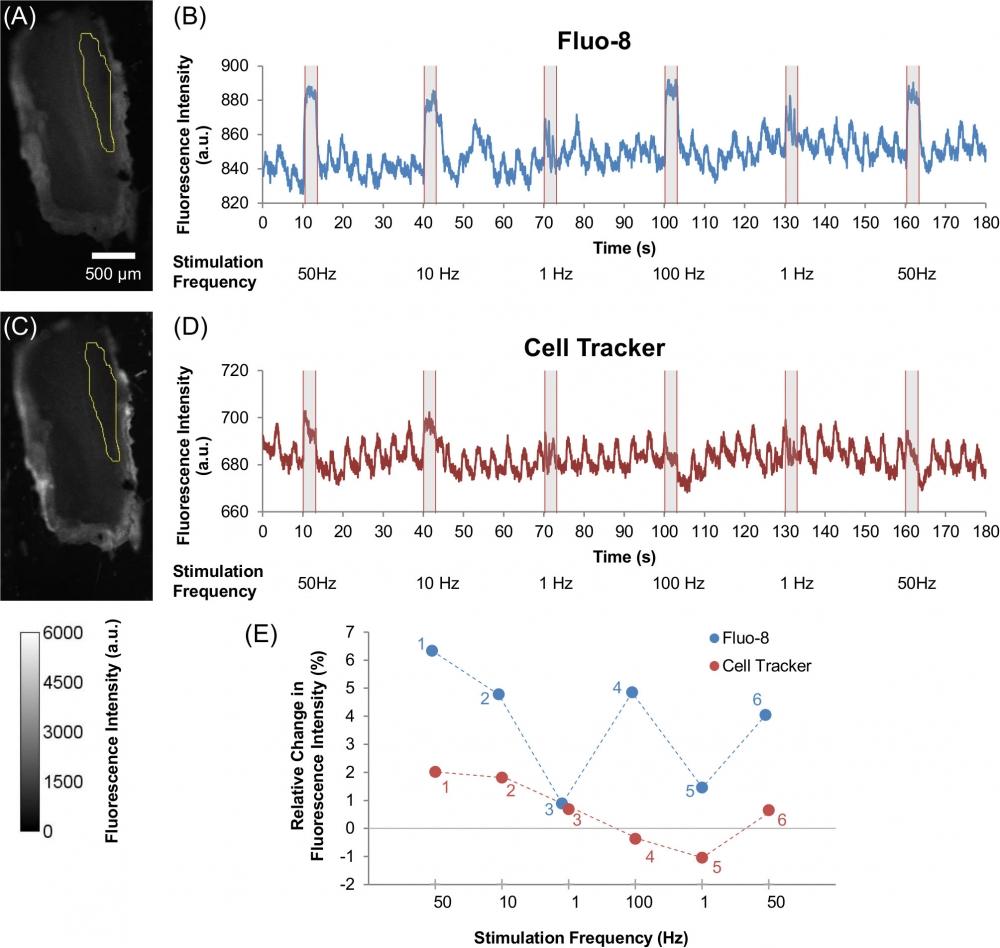
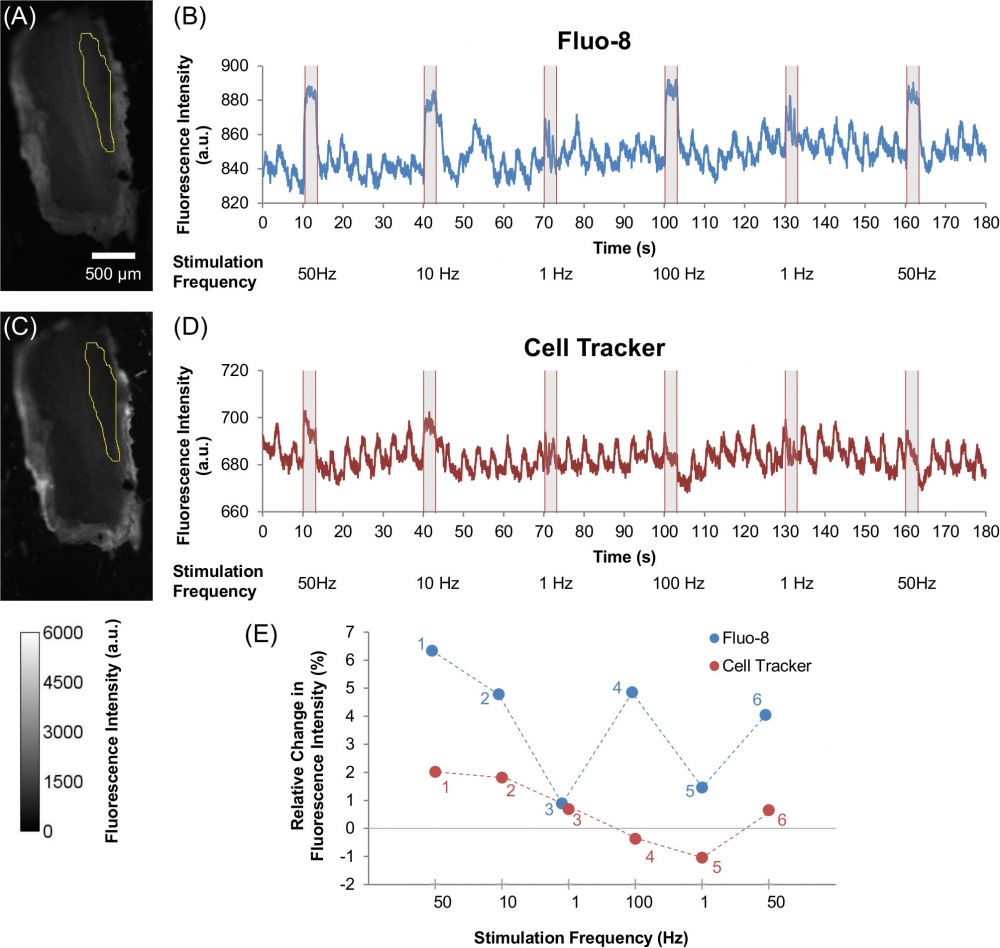
Figure 5. Effect of various electrical stimulation frequencies on Ca2+ dynamics and muscle displacement in beetle leg muscle. Images of beetle leg muscle that was dosed with (A) Fluo-8 (60 µM) and (C) Cell Tracker (60 µM), with the yellow selection indicating the ROI that was used for analysis (as also shown in S1B Fig.). The color scale is given at the bottom left corner of the image. Representative time courses showing the fluorescence intensity dynamics of (B) Fluo-8, and (D) Cell Tracker under various electrical stimulations of multiple pulse trains (50 Hz, 10 Hz, 1 Hz, 100 Hz, 1 Hz, and 50 Hz; 10% duty cycle; 2 V) observed from the ROI that are displayed in (A) and (C) respectively. All electrical stimulations were applied for 3 seconds periods with a 27 seconds resting period in between stimulations. The stimulus timing is indicated by grey shading. (E) Relative change in fluorescence intensity ((ΔF/F0)×100%) for Fluo-8 (blue) and Cell Tracker (red) under varying electrical stimulation frequencies (50 Hz, 10 Hz, 1 Hz, 100 Hz, 1 Hz, and 50 Hz; 10% duty cycle; 2 V). The small numbers next to each plot indicate the order of stimulation; i.e., first from 50 Hz followed by varying frequency pulses (10 Hz, 1 Hz, 100 Hz, 1 Hz, and 50 Hz). The Fluo-8 intensity plot shows that Ca2+ dynamics are dependent on electrical stimulation frequency, whereas the Cell Tracker plot shows that the muscle displacement contributes a small amount. Source: Graph from Oral Dosing of Chemical Indicators for In Vivo Monitoring of Ca2+ Dynamics in Insect Muscle by Ferdinandus et al., PLOS, Jan. 2015.
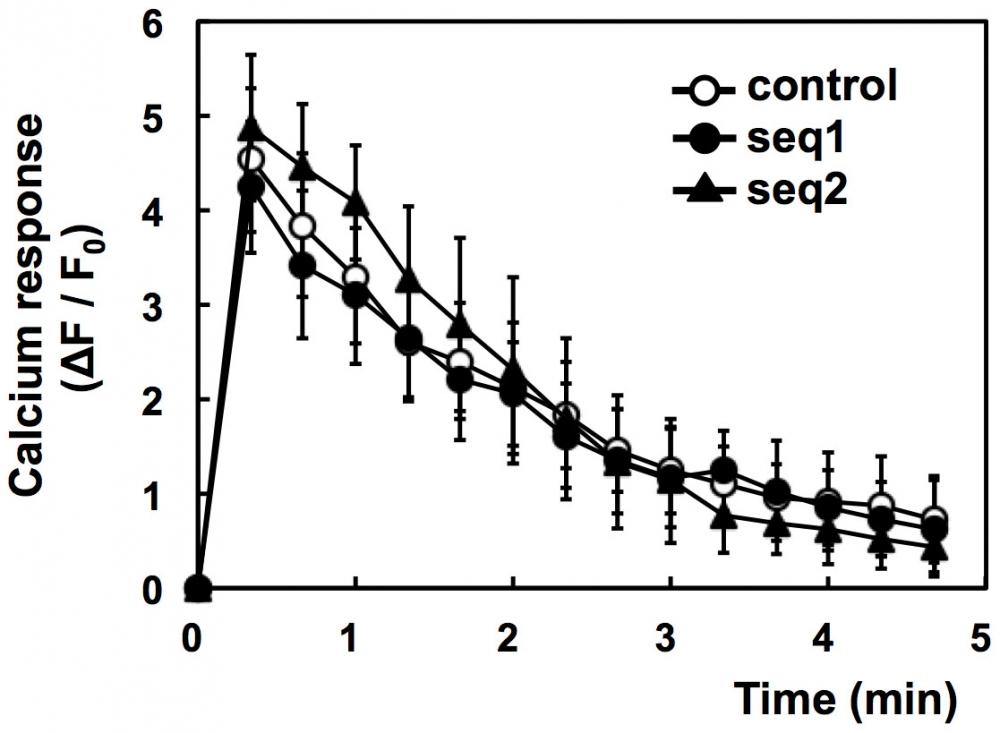
Figure 6. Failure of PI3K-C2α knockdown to inhibit antigen-induced calcium response. IgE-sensitized cells were incubated with Fluo-8 dye at 25°C for 20 min. The cells were washed and stimulated with 1 µM DNP-BSA at 30°C. The average fluorescence intensities (F) of the individual cells were monitored. The data are shown as ΔF/F0, where F0 is the basal F value obtained as the average intensity of the individual cells and ΔF is the difference between F and F0. The data were obtained from three separate experiments (24 cells were monitored in total) and are shown as the means ± s.d. Source: Graph from Involvement of Class II Phosphoinositide 3-Kinase α-Isoform in Antigen-Induced Degranulation in RBL-2H3 Cells by Kiyomi Nigorikawa et al., PLOS, Oct. 2014.
![Effects of ACO on [Ca<sup>2+</sup>]i transients in hiPSC-CMs. (A) Representative traces of the [Ca<sup>2+</sup>]i transients recorded in a hiPSC-CM at baseline and with subsequent exposure of ACO and ACO plus Bay K-8644. (B, C, and D) Bar-graphs show the changes in [Ca<sup>2+</sup>]i transient frequency, duration and amplitude in hiPSC-CMs. †p < 0.01, vs. baseline. ‡ p < 0.001, vs. ACO. n = 7. *[Ca<sup>2+</sup>]i transients were recorded in hiPSC-CMs using a LSM-710 laser-scanning confocal microscope (Carl Zeiss, Inc, Germany) with a 40×, 1.3 numerical aperture oil immersion objective and axial resolutions of 1.5 μm. Briefly, hiPSC-CMs were loaded with 2 μM Fluo-8 AM (AAT Bioquest, Inc. Sunnyvale, CA, USA) for 15 min at 37°C, and recorded in normal Tyrode’s solution. Source: Graph from <strong>L-Type Calcium Channel Inhibition Contributes to the Proarrhythmic Effects of Aconitine in Human Cardiomyocytes</strong> by Jianjun Wu et al., <em>PLOS ONE</em>, Jan. 2017. ](/_next/image?url=https%3A%2F%2Fimages.aatbio.com%2Fproducts%2Ffigures-and-data%2Ffluo-8-am%2Ffigure-for-fluo-8-am_VPsrM.jpg&w=3840&q=75)
Figure 7. Effects of ACO on [Ca2+]i transients in hiPSC-CMs. (A) Representative traces of the [Ca2+]i transients recorded in a hiPSC-CM at baseline and with subsequent exposure of ACO and ACO plus Bay K-8644. (B, C, and D) Bar-graphs show the changes in [Ca2+]i transient frequency, duration and amplitude in hiPSC-CMs. †p < 0.01, vs. baseline. ‡ p < 0.001, vs. ACO. n = 7. *[Ca2+]i transients were recorded in hiPSC-CMs using a LSM-710 laser-scanning confocal microscope (Carl Zeiss, Inc, Germany) with a 40×, 1.3 numerical aperture oil immersion objective and axial resolutions of 1.5 μm. Briefly, hiPSC-CMs were loaded with 2 μM Fluo-8 AM (AAT Bioquest, Inc. Sunnyvale, CA, USA) for 15 min at 37°C, and recorded in normal Tyrode’s solution. Source: Graph from L-Type Calcium Channel Inhibition Contributes to the Proarrhythmic Effects of Aconitine in Human Cardiomyocytes by Jianjun Wu et al., PLOS ONE, Jan. 2017.
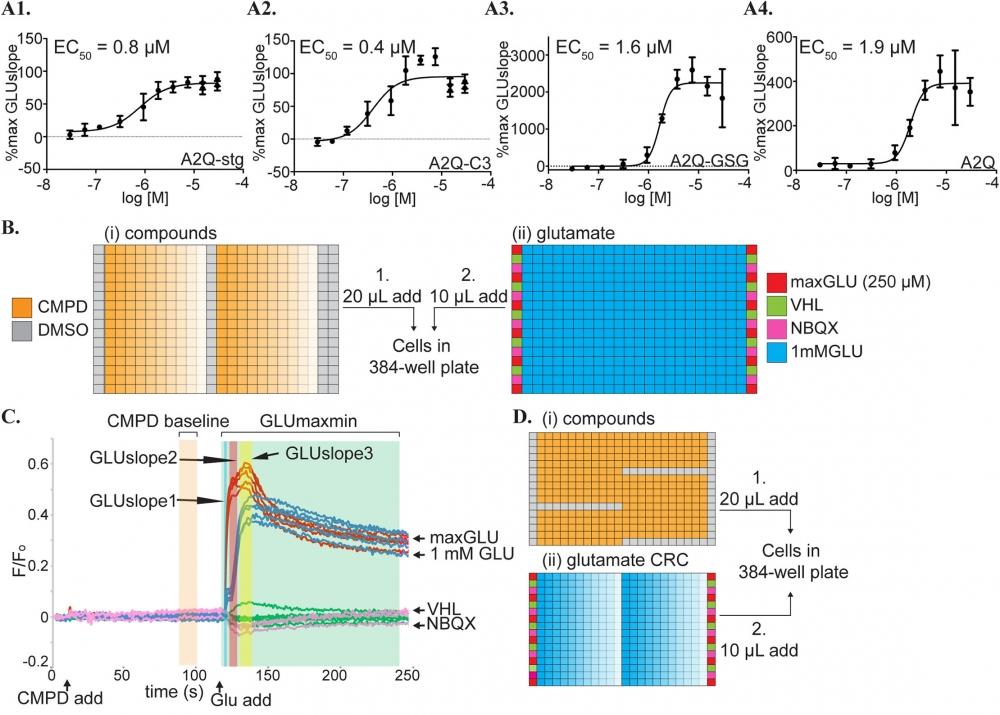
Figure 8. Controls and experimental setup for calcium flux assays. (A) CRC curves for CTZ in the presence of 1 mM glutamate from (1) A2Q-stg, (2) A2Q-C3, (3) A2-GSG, (4) A2Q cell lines in the calcium flux assay. These CRCs are calculated from the GLUslope1 (t = 122-125s) window. Calculated EC50 values are included in the top left of the graph. %max GLUslope = (GLUslope–mean VHLslope) / (mean maxGLUslope–mean VHLslope) as described in methods. (B) Compound and glutamate plates added to cells by the FDSS in our Fluo-8 calcium flux compound CRC assay. (i) Compounds (orange) are added as a 30 μM– 30 nM CRC (decreasing color saturation). (ii) Controls to determine a Z’ for each plate line the edges of the glutamate plates. Positive control = 250 μM glutamate (maxGLU, red), high calcium buffer vehicle (VHL, green), and negative control = 30 μM NBQX (NBQX, pink). 1 mM glutamate is added across the plate (blue) with columns 12 and 23 used as a 1mM glutamate and DMSO control. (C) Vehicle subtracted, normalized fluorescence data readout for the FDSS on A2Q-stg cells in a calcium flux experiment showing the compound and glutamate applications at 10s and 120s, respectively. Controls are shown in colors corresponding to their colors in the glutamate plate in (D). Different hit windows are shaded in blue (GLUslope1, 122-125s), red (GLUslope2, 126-132s), yellow (GLUslope3, 140-150s), green (GLUmaxmin). The orange window is a reference baseline (CMPD baseline) prior to the glutamate addition used to determine if the compound shows activity in the absence of glutamate. (D) Compound and glutamate plates added to cells by the FDSS in our Fluo-8-based glutamate potency fold-shift assay. (i) Compounds (orange) are first added at 30 μM with DMSO controls in columns 1,24, and also in K1-K12, F13-23, P13-23, overlapping with glutamate concentration curves for a per plate comparison to compound. (ii) Controls are loaded on the edge as in (Bii) and a glutamate CRC is loaded horizontally ranging from 4 mM to 10 pM (decreasing color saturation). *Compounds that were selected as hits using the VSD assay were subsequently screened against the calcium permeable A2Q-stg and A2Q-C3 cell lines in a glutamate potency fold-shift assay using the calcium sensing dye Fluo-8 (AAT Bioquest cat #21080). Source: Graph from Screening for AMPA receptor auxiliary subunit specific modulators by Caleigh M. Azumaya, et al., PLOS ONE, Mar. 2017.
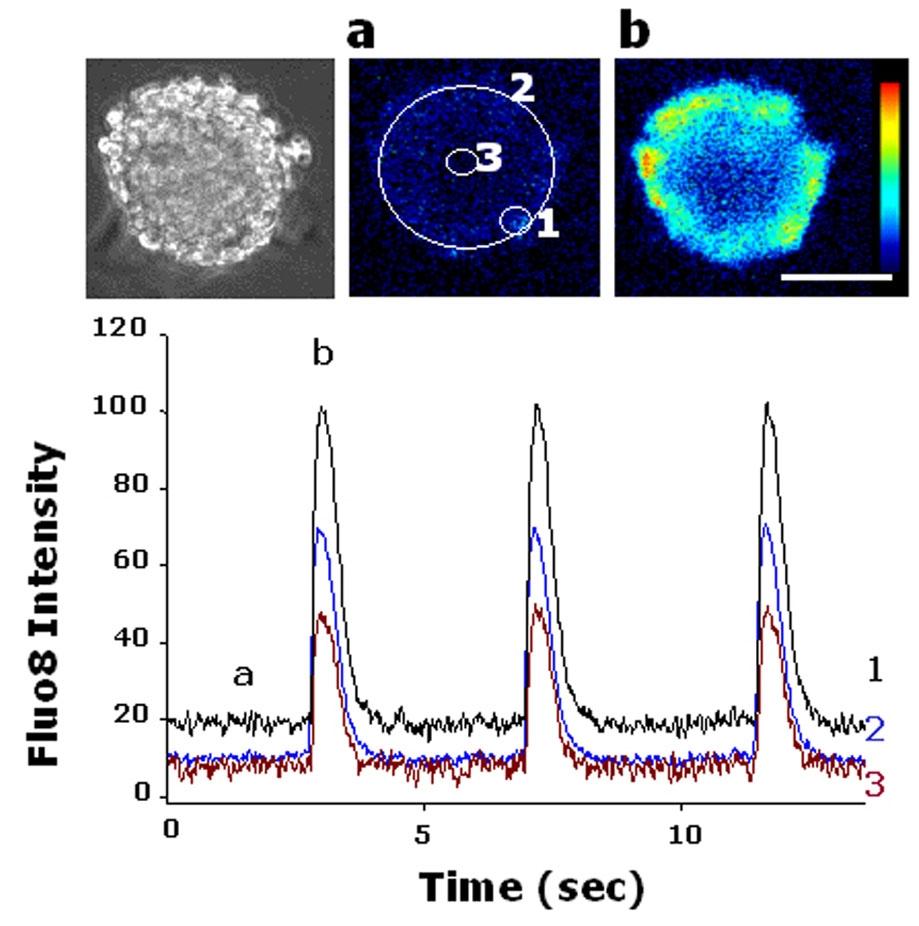
Figure 9. Functional analysis of expanded human cardiomyocytes. Ca++ transient in dissociated beating colonies. Cytoplasmic Ca++ change was monitored with fluo-8. Left panel: a transmission image of fluo-8 loaded iPSC colony. Middle and right panels: Fluo-8 images at the end (a) and the peak (b) of the fluorescence change. Scale bar?=?50 µm. Lower panel: Time course of fluo-8 intensity change. The intensity was measured at the periphery (1), the entire colony (2) and the center (3) (ROIs shown in middle panel). Ratios (F1/F0) of the intensity to the one at the beginning of recording (F0) are indicated. Note that Ca transient is well synchronized within the colony. Real time video is shown in Movie S3. *Human iPSCs were loaded with 4 µM Quest Fluo-8 (ABD Bioquest, Inc. Sunnyvale, CA) for 30 min. Source: Graph from Induction and Enhancement of Cardiac Cell Differentiation from Mouse and Human Induced Pluripotent Stem Cells with Cyclosporin-A by Masataka Fujiwara, et al., PLOS ONE, Feb. 2011.
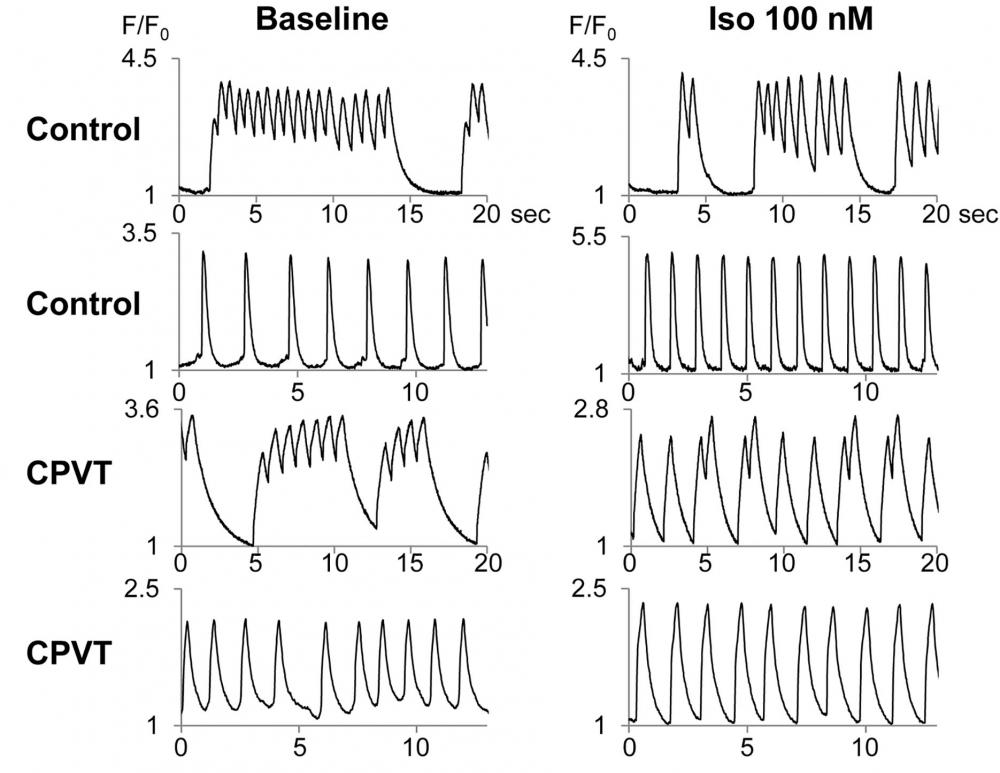
Figure 10. Ca2+ imaging of spontaneously beating hiPSC-CMs. Representative tracings of Ca2+ imaging in spontaneously contracting control- and CPVT-hiPSC-CMs. *The hiPSC-CMs were dispersed with collagenase B and Trypsin EDTA and plated onto glass coverslips coated with fibronectin (BD Biosciences, San Jose, CA, USA). After 5–7 days, dissociated hiPSC-CMs on a coverslip were loaded with 2 µmol/L Fluo-8 (AAT Bioquest, Sunnyvale, CA, USA) in the culture medium described above. Source: Graph from Patient-Specific Human Induced Pluripotent Stem Cell Model Assessed with Electrical Pacing Validates S107 as a Potential Therapeutic Agent for Catecholaminergic Polymorphic Ventricular Tachycardia by Kenichi Sasaki, et al., PLOS ONE, Oct. 2016.
![Effect of Glucose and 3-O-Methylglucose on [Ca2+]c Measured by Fluo-8. A: Fluo-8-loaded cells were stimulated by 25 mM glucose and changes in [Ca2+]c were measured. A typical response with a rapid peak is presented. The trace is a respresentative of those-obtained in more than 100 cells. B: Fluo-8-loaded cells were incubated in Ca2+-free HBSS and stimulated by 25 mM glucose as shown by the arrow. The trace is a representative of those obtained in more than 100 cells. C: Fluo-8-loaded cells were stimulated by 25 mM glucose in the presence of 1 μM nifedipine, which was added 10 min pror to the stimulation by glucose. Changes in [Ca2+]c were monitored. The trace is a representative of those obtained in more than 100 cells. D: Fluo-8-loaded cells preincubated for 10 min with 10 mM mannoheptulose were stimulated with 25 mM glucose as indicated by the arrow. The trace is a representative of those obtained in more than 100 cells. E: Fluo-8-loaded cells were stimulated by 25 mM 3-O-methylglucose and changes in [Ca2+]c were monitored. The trace is a representative of those obtained in more than 100 cells. F: Fluo-8-loaded cells were stimulated by 25 mM glucose in the presence of 5 mM lactisole, which was added 10 min prior to the stimulation by glucose. Changes in [Ca2+]c were monitored. The trace is a representative of those obtained in more than 100 cells. G: Experiments were carried out as shown in F and AUC from 1 to 5 min was calculated. Values are the mean ± SE for 10 determinations. Source: <em>Graph from Glucose Evokes Rapid Ca2+ and Cyclic AMP Signals</em> <em>by Activating the Cell-Surface Glucose-Sensing Receptor in Pancreatic β-Cells</em> by Yuko Nakagawa et al. PLOS, Dec. 2015.](/_next/image?url=https%3A%2F%2Fimages.aatbio.com%2Fproducts%2Ffigures-and-data%2Ffluo-8-am%2Ffigure-for-fluo-8-am_LDtwg.jpg&w=3840&q=75)
Figure 11. Effect of Glucose and 3-O-Methylglucose on [Ca2+]c Measured by Fluo-8. A: Fluo-8-loaded cells were stimulated by 25 mM glucose and changes in [Ca2+]c were measured. A typical response with a rapid peak is presented. The trace is a respresentative of those-obtained in more than 100 cells. B: Fluo-8-loaded cells were incubated in Ca2+-free HBSS and stimulated by 25 mM glucose as shown by the arrow. The trace is a representative of those obtained in more than 100 cells. C: Fluo-8-loaded cells were stimulated by 25 mM glucose in the presence of 1 μM nifedipine, which was added 10 min pror to the stimulation by glucose. Changes in [Ca2+]c were monitored. The trace is a representative of those obtained in more than 100 cells. D: Fluo-8-loaded cells preincubated for 10 min with 10 mM mannoheptulose were stimulated with 25 mM glucose as indicated by the arrow. The trace is a representative of those obtained in more than 100 cells. E: Fluo-8-loaded cells were stimulated by 25 mM 3-O-methylglucose and changes in [Ca2+]c were monitored. The trace is a representative of those obtained in more than 100 cells. F: Fluo-8-loaded cells were stimulated by 25 mM glucose in the presence of 5 mM lactisole, which was added 10 min prior to the stimulation by glucose. Changes in [Ca2+]c were monitored. The trace is a representative of those obtained in more than 100 cells. G: Experiments were carried out as shown in F and AUC from 1 to 5 min was calculated. Values are the mean ± SE for 10 determinations. Source: Graph from Glucose Evokes Rapid Ca2+ and Cyclic AMP Signals by Activating the Cell-Surface Glucose-Sensing Receptor in Pancreatic β-Cells by Yuko Nakagawa et al. PLOS, Dec. 2015.
![Bupivacaine treatment leads to an increase in cytosolic Ca2+ ([Ca2+]i). SH-SY5Y cells were either pretreated with the indicated concentrations of NNC 55-0396 dihydrochloride or left untreated prior to 1 mM bupivaine treatment for 24 h. [Ca2+]i levels were measured by Quest Fluo-8 AM ester (mean±SD, n?=?6)). A: Representative image of Quest Fluo-8 AM ester flow cytometry analysis. Source: Graph from Neurotoxicity Induced by Bupivacaine via T-Type Calcium Channels in SH-SY5Y Cells by Xianjie Wen et al., PLOS, May 2013.](/_next/image?url=https%3A%2F%2Fimages.aatbio.com%2Fproducts%2Ffigures-and-data%2Ffluo-8-am%2Ffigure-for-fluo-8-am_2P54h.jpg&w=3840&q=75)
Figure 12. Bupivacaine treatment leads to an increase in cytosolic Ca2+ ([Ca2+]i). SH-SY5Y cells were either pretreated with the indicated concentrations of NNC 55-0396 dihydrochloride or left untreated prior to 1 mM bupivaine treatment for 24 h. [Ca2+]i levels were measured by Quest Fluo-8 AM ester (mean±SD, n?=?6)). A: Representative image of Quest Fluo-8 AM ester flow cytometry analysis. Source: Graph from Neurotoxicity Induced by Bupivacaine via T-Type Calcium Channels in SH-SY5Y Cells by Xianjie Wen et al., PLOS, May 2013.
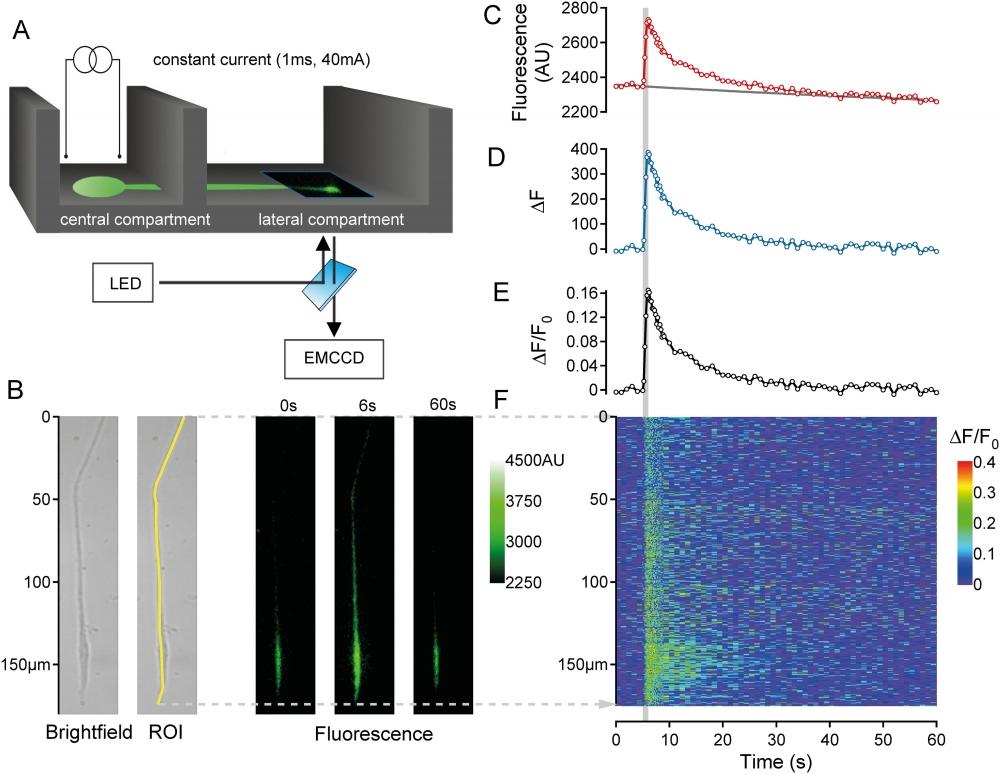
Figure 13. Recording and analysis of calcium signals in outgrowing neurites. (A) Schematic illustrating DRG neurons (green) cultured in the central compartment of a Campenot chamber that extended neurites into the lateral compartment. Fluorescent images were acquired from the lateral compartment. Constant current field stimulation (1s, 40mA, 20Hz) was applied in the central compartment. (B) Neurites were initially identified under brightfield illumination (B, left) and calcium (Fluo-8®, AM) fluorescence images (B, right) were acquired sequentially at 1Hz for 60s, with an increase in acquisition rate to 5Hz during the 5-10s period. A region of interest (ROI) was selected from the brightfield image (B, left) and used to determine average fluorescence (AU) within the ROI (C, red markers) for each image across time. A single exponential fit was used to determine baseline fluorescence (F0; C, solid grey line). The change in fluorescence (ΔF = F-F0; D, blue markers) was determined as the difference between raw (C, red markers) and fitted baseline fluorescence values (C, solid grey line). This difference signal was subsequently divided by the baseline fluorescence (C, solid grey line) to yield a fluorescence ratio (ΔF/F0) (E, black markers). In addition to average fluorescence values (C-E) the spatio-temporal distribution of fluorescence (panel F, color-coded) was determined by calculating the fluorescence ratio (ΔF/F0) for each individual pixel along the ROI (F, y-axis in μm) as a function of time, i.e. each image during the acquisition period (F, Time axis). Source: Graph from Assessment of TTX-s and TTX-r Action Potential Conduction along Neurites of NGF and GDNF Cultured Porcine DRG Somata by Robin Jonas et al., PLOS, Sep. 2015.
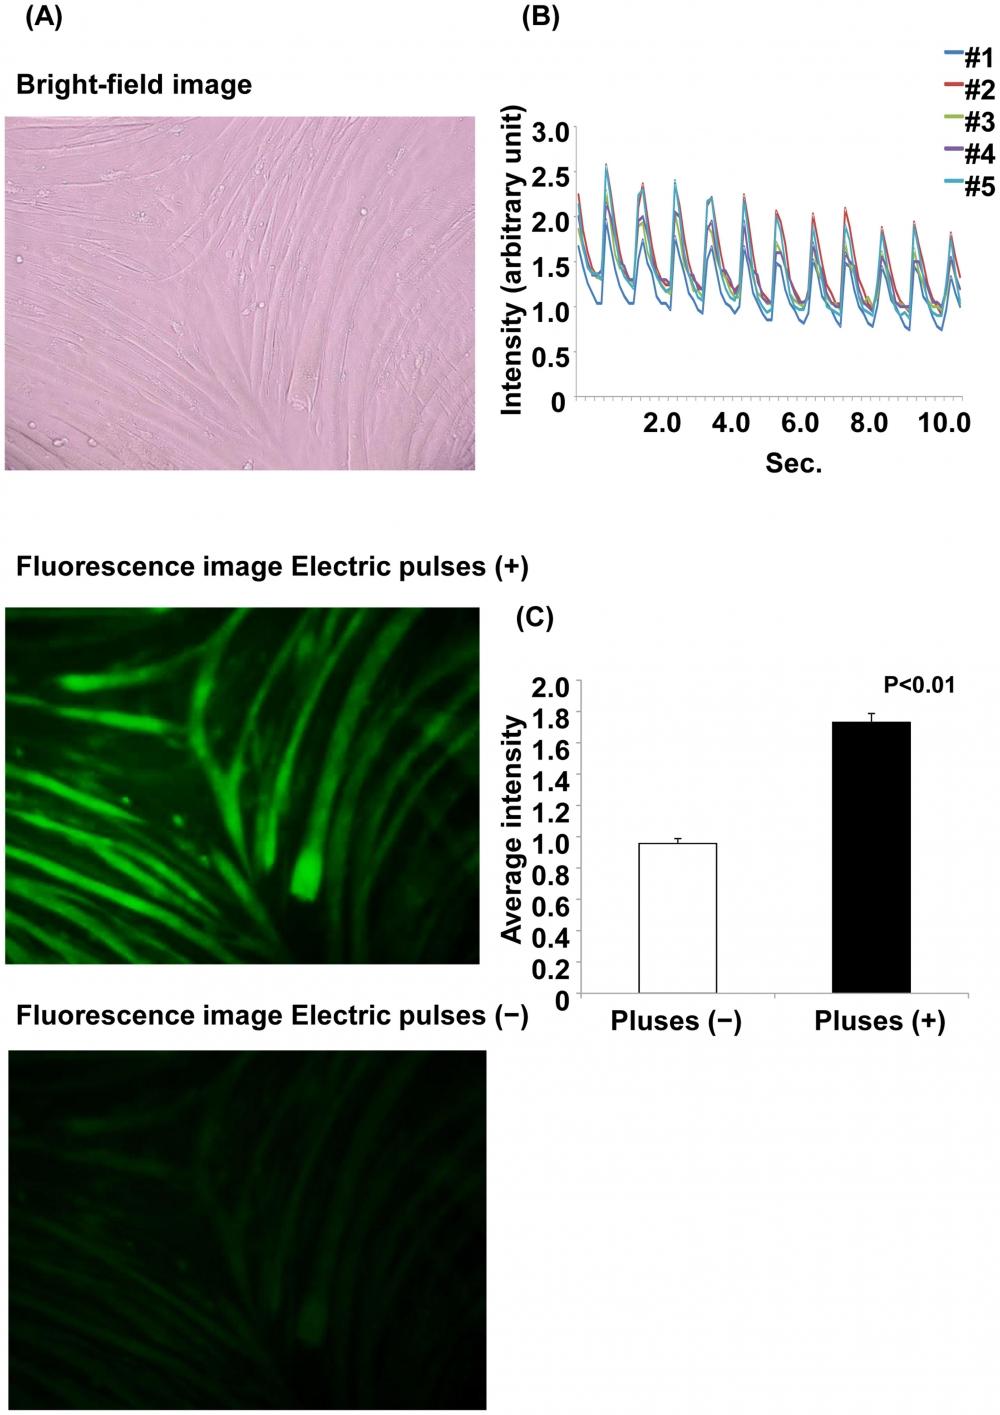
Figure 14. Ca2+ fluorescence with and without electrical stimulation. (A) Ca2+ fluorescence with and without electrical stimulation. Myotubes were treated with Fluo-8 dye loading solution 30 min before electrical stimulation. The images are shown at 200× magnification. The upper panel shows the bright-field image. The middle panel shows the myotubes with electric pulses, and the lower panel shows the myotubes without electric pulses. (B) Changes in Ca2+ fluorescence intensity with electrical stimulation. The fluorescence intensity was analyzed at 5 arbitrary points. Each line shows the raw fluorescence intensity data at each point. (C) The average fluorescence intensity for 11 s is shown. The average fluorescence intensity with electric pulses is significantly higher than that without electric pulses (p<0.01, Student’s t-test). Source: Graph from Characterization of an Acute Muscle Contraction Model Using Cultured C2C12 Myotubes by Yasuko Manabe et al., PLOS, Dec. 2012.

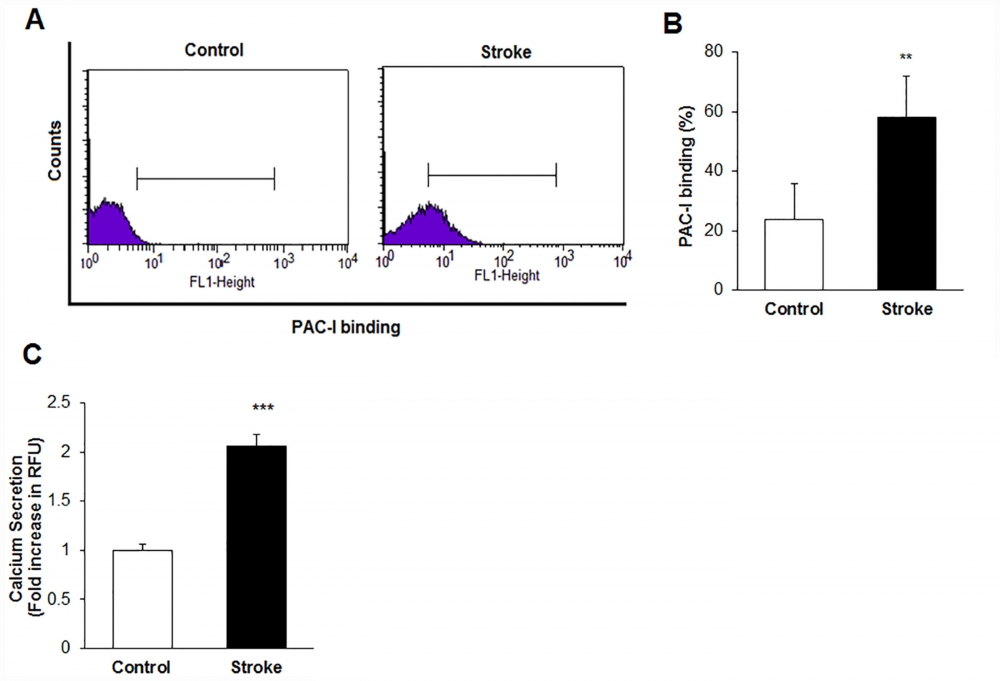
Figure 15. Platelet intracellular calcium flux was measured with a Fluo-8 calcium assay kit (AAT Bioquest). Fluo-8 solution and dye-loading solution was added to the platelet suspensions and platelet cells were incubated for 30 min at 37°C. The Ca2+ level was determined by monitoring the fluorescence intensity in Ex/Em = 490/525 nm with a fluorescence microplate reader (Glomax, Promega, USA).A) Histogram of Platelet activation responses using PAC-I binding by flow cytometry in the control and stroke patient groups. B) The percentage of PAC-I binding in the stroke and control subjects (**p < 0.01 versus control group) C) Platelet Ca+2 levels secretion in the stroke and control subjects (**p < 0.001 versus control group). Source: Graph from Platelets Proteomic Profiles of Acute Ischemic Stroke Patients by Ozge Cevik et al., PLOS, Jun. 2016.
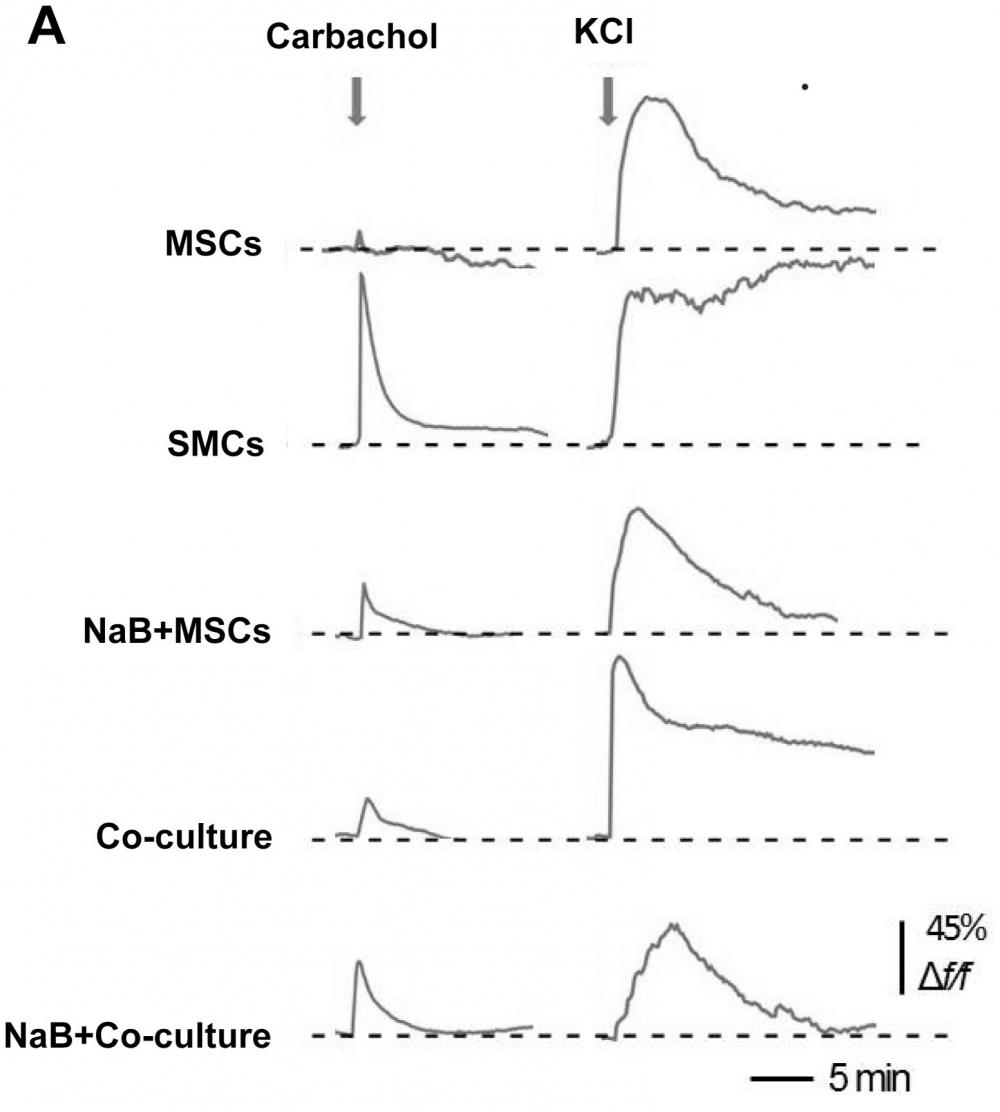
Figure 16. Measurement of intracellular calcium levels. (A) The traces show the carbachol- (10 mM) and KCl (100 mM)-induced Ca2+ response in MSCs, SMCs, MSCs treated with 1 mM NaB for 48 h, and NaB-pretreated (1 mM for 48 h) MSCs co-cultured with SMCs for 3 d. F/F0 denotes the relative change in Fluo-8 intensity, F0 is the baseline average and F is the absolute fluorescence value in an area of interest during treatment. Forty-five percent means that 45 of one hundred cells exhibited a response. Source: Graph from
Sodium Butyrate Promotes the Differentiation of Rat Bone Marrow Mesenchymal Stem Cells to Smooth Muscle Cells through Histone Acetylation by Jingxia Liu et al., PLOS, Dec. 2014.
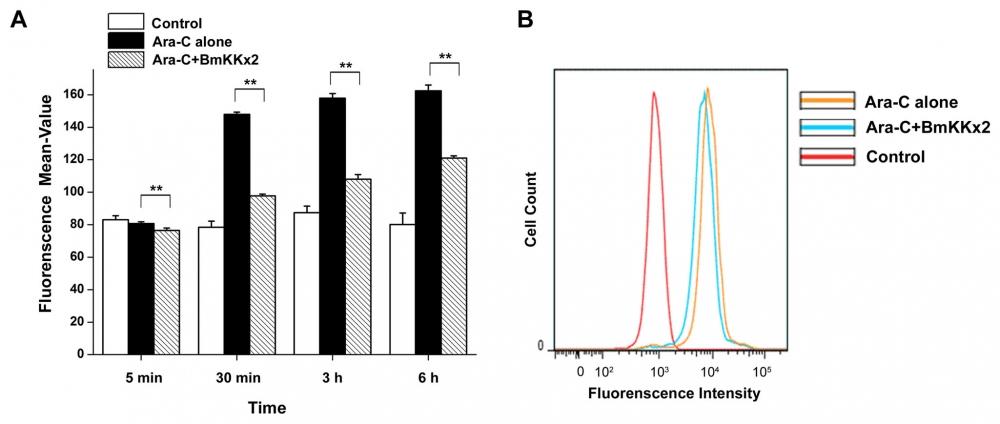
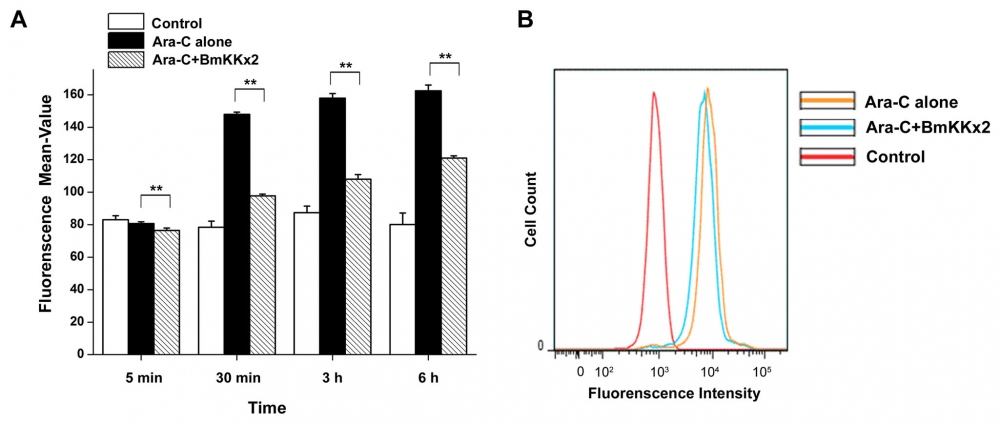
Figure 17. BmKKx2 binding causing the Ca2+ concentration decrease during the erythroid differentiation of K562 cells. (A) Intracellular Ca2+ was stained by Fluo-8, and the Ca2+ concentration was measured by flow cytometric analysis. The mean values were mean ± SD from three independent experiments. **p<0.01 (Student’s t-test). (B) Flow cytometric analysis of Fluo-8 fluorescence intensity in K562 cells with or without BmKKx2 after Ara-C induced for 24 h. Source: Graph from hERG Potassium Channel Blockage by Scorpion Toxin BmKKx2 Enhances Erythroid Differentiation of Human Leukemia Cells K562 by Jian Ma et al., PLOS, Dec. 2013
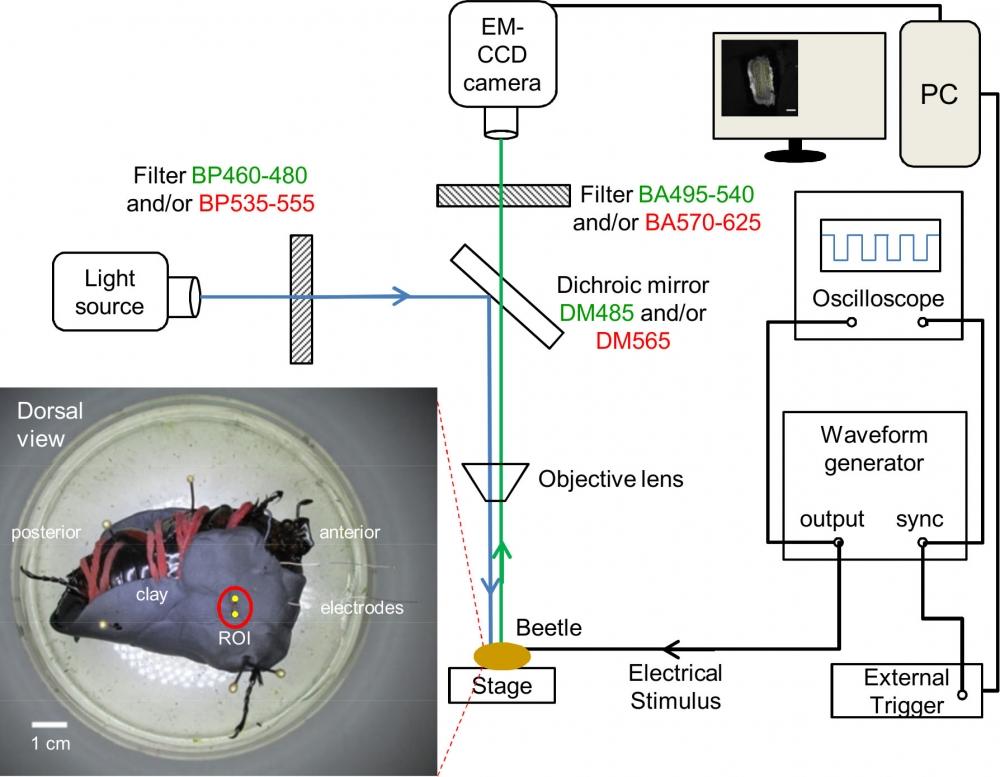
Figure 18. Illustration of fluorescence microscopy and electrical stimulation setups. The filter and mirror set in green font is used to observe Fluo-8, Rhodamine 123, and DiBAC4(3). The filter and mirror set in red font is used to observe Cell Tracker and Rhodamine B. Inset, dorsal view of the beetle fixed upside down on dissection plate using clay, rubber bands (in red), and insect pins. Two PFA-coated thin silver wire electrodes (one working electrode and one counter electrode) were inserted into the ends of the muscle that are marked by 2 yellow dots. The insertion depth is approximately 2 mm, as measured from the outer cuticle. The red circle indicates the observation window that was used to observe the flexion muscle, which located inside the femur of the beetle leg. Source: Graph from Oral Dosing of Chemical Indicators for In Vivo Monitoring of Ca2+ Dynamics in Insect Muscle by Ferdinandus et al., PLOS, Jan. 2015.
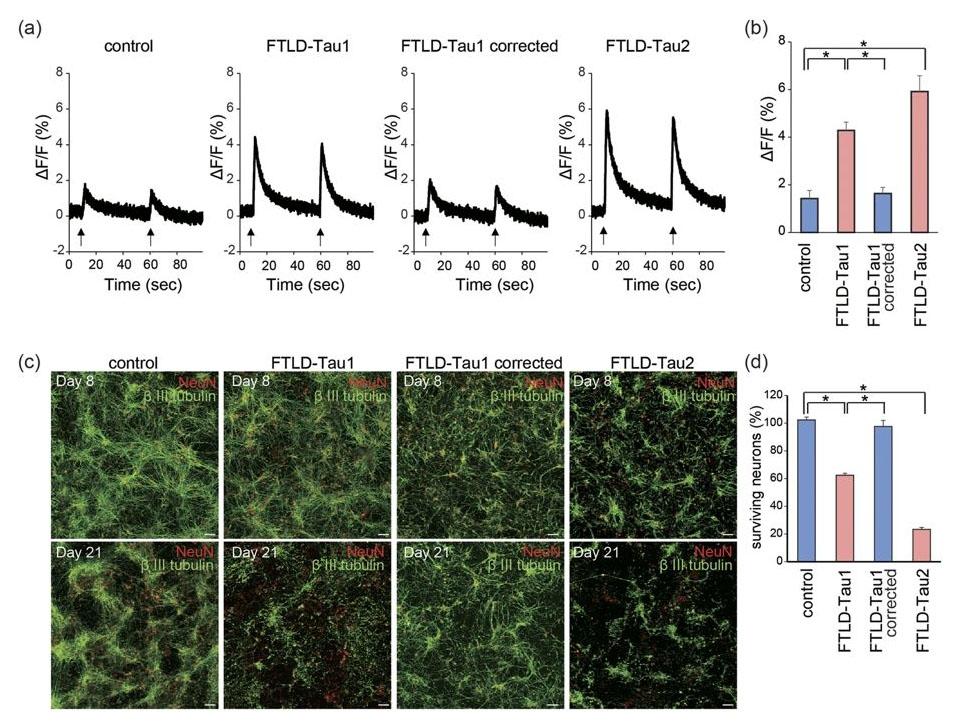
Figure 19. Calcium dysregulation and neuronal loss of FTLD-Tau neurons. (a,b) Calcium imaging after electrical stimulation. Intracellular Ca2+ levels, elevated by electrical stimulation, were higher in FTLD-Tau neurons than in control (n = 6; one-way ANOVA, p < 0.05; post hoc test, *p < 0.05). (c,d) Immunofluorescence staining of βIII tubulin and NeuN on Days 8 and 21 in control and FTLD-Tau neurons. Survival of FTLD-Tau neurons from Day 8 to Day 21 was decreased compared to control neurons (n = 6; one-way ANOVA, p < 0.05; post hoc test, *p < 0.05). Source: Calcium dysregulation contributes to neurodegeneration in FTLD patient iPSC-derived neurons by Imamura et al., Scientific Reports, Oct. 2016.
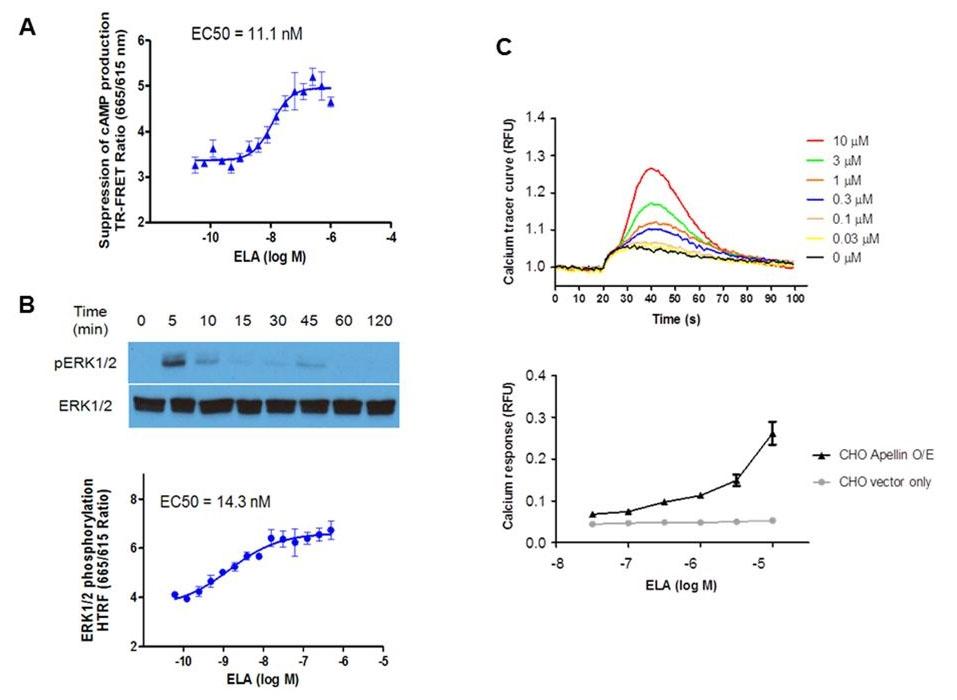
Figure 20. Down-stream signaling of APJ activation by ELA. (A). Suppression of cAMP production by ELA. CHO cells expressing APJ were treated with forskolin (10 μM) and ELA at the indicated concentrations. The amount of cAMP was measured by TR-FRET. Higher TR-FRET ratio indicates less cAMP production. (B). Phosphorylation of ERK1/2 by ELA. Upper panel: APJ-expressing CHO cells were treated with ELA (1 μΜ) at the indicated times and lysed for Western blot analysis by antibodies of phosphorylated form of ERK (pERK1/2) and unphosphorylated ERK1/2 (ERK1/2). (B). Dose response of ERK phosphorylation by ELA. APJ-expressing CHO cells were treated with ELA at the indicated concentrations and assayed for HTRF ratio by TR-HTRF. (C). Intracellular calcium mobilization by ELA. CHO cells expressing human APJ were treated with ELA at the indicated concentration and calcium mobilization was monitored by fluorescent calcium dye Fluo8 for up to 100 seconds (upper panel). Lower panel: calcium response to ELA in APJ-expressing cells vs. vector control cells. Values are mean ± SEM (n = 3–5). Source: Elabela-apelin receptor signaling pathway is functional in mammalian systems by Wang et al., Scientific Reports, Feb. 2015.
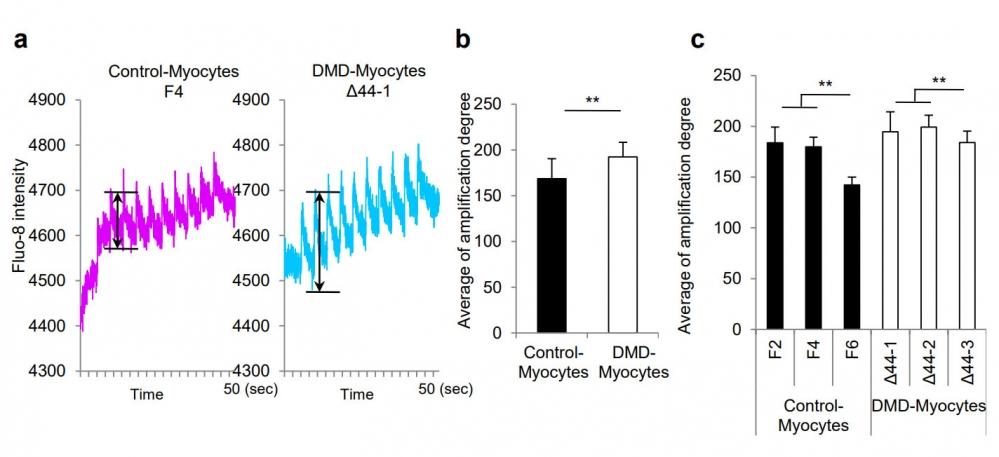
Figure 21. Supplementary Figures (a) Representative profile of Ca2+ influx pattern through Fluo-8 intensity in response to electric stimulation. Electric pulse was applied to cells after 5 sec of stationary phase at a constant frequency of 0.2 Hz at 12 V for one minute. The amplitudes are indicated with double arrowheads. (b) Quantitative analysis of Fluo-8 intensity amplitudes in both Control-Myocytes father and Δ44 DMD-Myocytes. n = 12, **p < 0.01. (c) Quantitative analysis of Fluo-8 intensity amplitudes in three clones of Control-Myocytes father and DMD-Myocytes Δ44. n = 8, **p < 0.01. Source: Early pathogenesis of Duchenne muscular dystrophy modelled in patient-derived human induced pluripotent stem cells by Shoji et al., Scientific Reports, Aug. 2015.
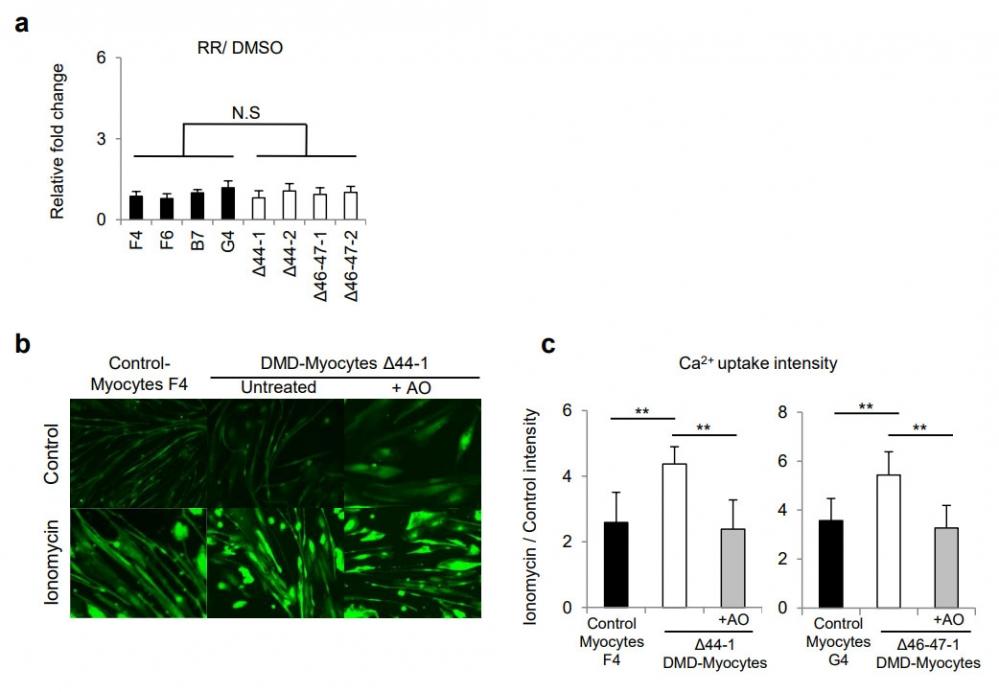
Figure 22. Supplementary Figures (a) CK activity was measured after the addition of RR, TRP family channel inhibitor. CK values were normalised with CK value of DMSO treated samples. (b) Images of myotubes with fluorescent Fluo-8 intensity, visualising Ca2+ influx. Scale bar, 200 µm. (c) Ca2+ uptake was measured by Fluo-8 intensity in myotubes and quantified. Six myotubes were selected from each Control-, DMD-, and DMD-Myocytes+AO, skeletal muscle cells. Relative fluorescence intensities were normalized to the control intensity in each sample. **P < 0.01 Triplicate experiments for each condition. n = 3. Source: Early pathogenesis of Duchenne muscular dystrophy modelled in patient-derived human induced pluripotent stem cells by Shoji et al,. Scientific Reports, Aug. 2015.
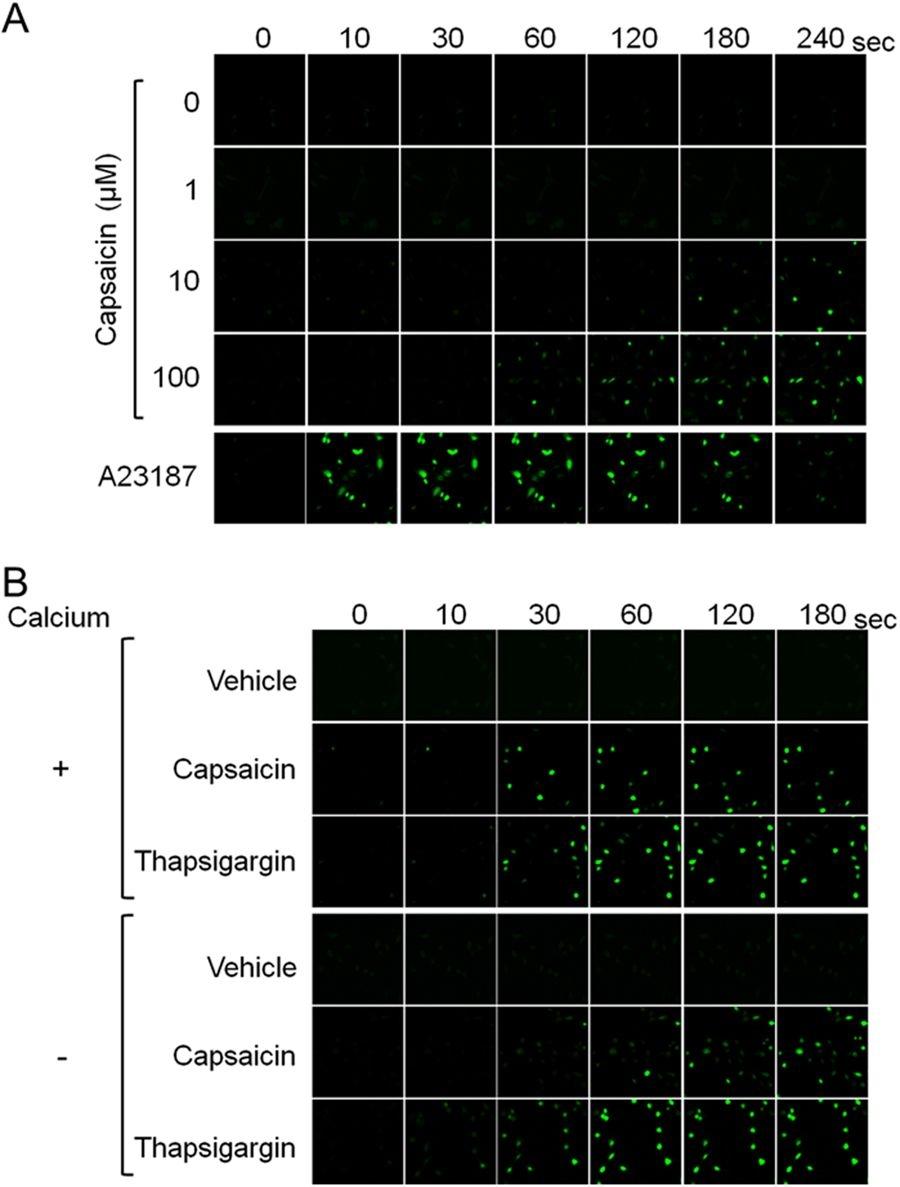
Figure 23. Increased cytosolic calcium level in response to supra-pharmacological capsaicin, irrespective of extracellular calcium. (A) HB2 brown preadipocytes loaded with Fluo-8 AM were treated with the indicated concentrations of capsaicin or A23187 (1 μM), and cytosolic calcium level was evaluated. (B) Effect of the depletion of extracellular calcium was evaluated. Cells were treated with vehicle, capsaicin (100 μM) or thapsigargin (100 nM). Source: Supra-pharmacological concentration of capsaicin stimulates brown adipogenesis through induction of endoplasmic reticulum stress by Kida et al., Scientific Reports, Jan. 2018.
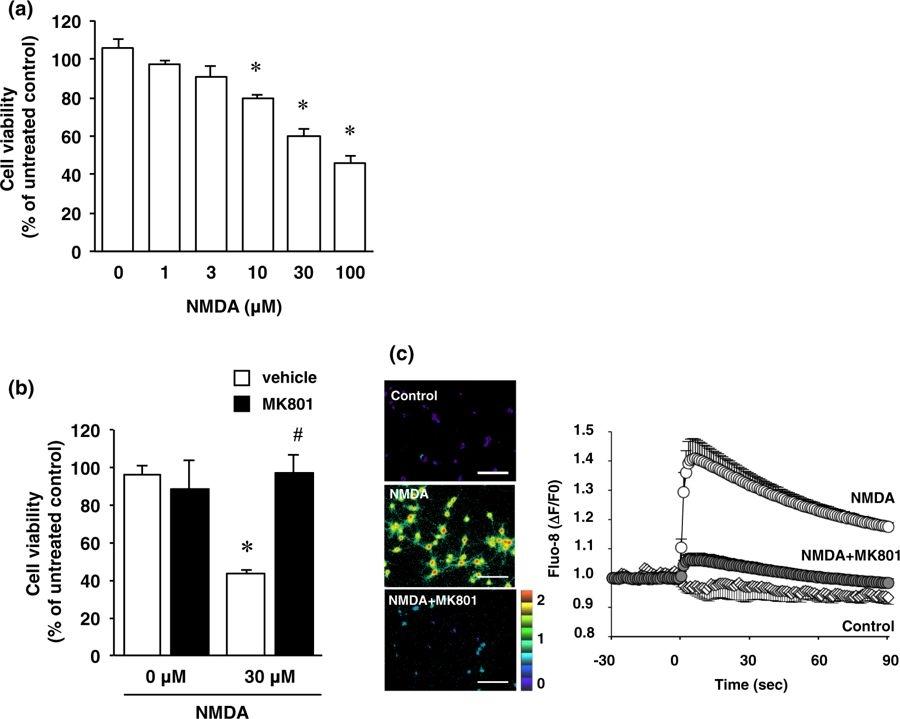
Figure 24. Cortical neurons were exposed to various concentrations of NMDA (1–100 µM) for 15 min. (a) Effect of NMDA treatment on cell viability. Cortical neurons were incubated with NMDA at the indicated concentrations for 15 minutes. After 24 h of NMDA treatment, cell viability was determined by performing the XTT dye-reduction assay. The absorbance at 450 nm was measured, and the relative cell viability was expressed as the percentage of the absorbance at 450 nm of each treatment group against that of the untreated control group. Results are the means ± SE (n = 5 independent experiments). *Indicates a significant difference from the NMDA-untreated group (p < 0.05). (b) Effect of NMDA receptor antagonist on NMDA-induced cell injury. Cell viability in cultures of 0 µM and 30 µM NMDA-treated cells without (white bars) or with (black bars) 10 µM MK-801. The relative cell viability was expressed as the percentage of the absorbance at 450 nm of each treatment group against that of the untreated control group. Results are the means ± SE (n = 3 independent experiments). *Indicates a significant difference from the NMDA-untreated group (p < 0.05); and #, a significant difference from the NMDA-treated and MK801-untreated group (p < 0.05). (c) Cortical neurons were labeled with Fluo-8 acetoxymethyl ester for 30 min, and then 30 µM NMDA was added with or without 10 µM MK-801. Fluorescence ratio images are displayed in pseudocolor as indicated by the color bar. Pseudocolor represents changes in fluorescence ratios between 0 (blue) and 2 (red) corresponding to 1 (green), which is defined as the basal fluorescence intensity before NMDA stimulation. Representative ratio images of cortical neuron cultures incubated with 0 µM NMDA (Control), 30 µM NMDA (NMDA) or 30 µM NMDA and 10 µM MK-801 (NMDA + MK-801) are shown. Scale bar represents 100 µm. In the right panel, changes in Fluo-8 fluorescence are expressed as ΔF/F0, where F0 is basal fluorescence intensity before NMDA stimulation. Results are the means ± SE (n = 5 independent experiments). Source: Furin inhibitor protects against neuronal cell death induced by activated NMDA receptors by Yamada et al., Scientific Report, March 2018.
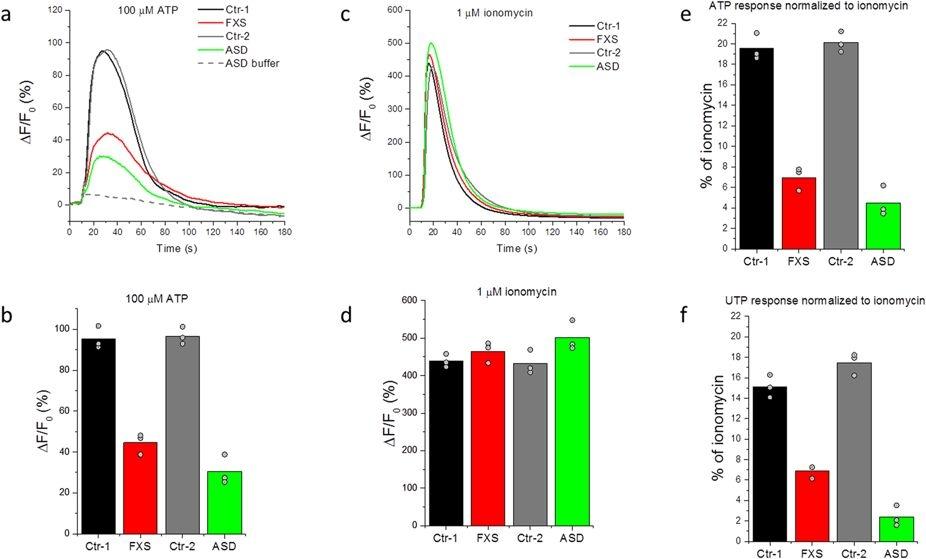
Figure 25. Representative Ca2+ responses to extracellular application of purinergic agonists and ionomycin in absence of extracellular Ca2+ in fibroblasts from ASD subjects and controls. (a) Representative FLIPR traces showing changes in Fluo-8 fluorescence over the basal fluorescence (ΔF/F0) in response to extracellular application of 100 μM ATP to fibroblast cell lines from two controls (black; GM03440 and grey; GM02912), one FXS (red; GM09497) and one sporadic ASD subject (green; AU0027-0202). Fluorescence changes ΔF are presented as a % change from the basal fluorescence F0. The grey dashed line represents the artifactual fluorescence change resulting from addition of vehicle alone to the ASD cell line. (b) Peak amplitudes (ΔF) of Ca2+ responses to 100 μM ATP normalized to the basal fluorescence (F0) before stimulation in control cell lines (black and grey), FXS (red) and a sporadic ASD line (green). Bar graphs show mean of triplicate measurements after subtracting the artifactual signal resulting from addition of vehicle alone to each corresponding cell line. Data points represent individual triplicate responses. (c) Representative FLIPR traces showing changes in fluorescence over the basal (ΔF/F0) in response to extracellular application of 1 μM ionomycin to control (black and grey traces), FXS (red) and ASD (green) cell lines. (d) Mean peak Ca2+ responses (ΔF) to 1 μM ionomycin normalized to the basal fluorescence (F0) before stimulation in control cell lines (black and grey), FXS line (red) and an ASD line (green). Bar graphs show mean of triplicate measurements. Data points represent individual triplicate responses. (e) Mean peak ATP responses for each cell line from (b) expressed as a percentage of the mean ionomycin response from (d) in that cell line. (f) Mean peak responses evoked by addition of 100 μM UTP to each cell line as a percentage of the of ionomycin response for that cell line. Source: High-throughput screen detects calcium signaling dysfunction in typical sporadic autism spectrum disorder by Schmunk et al., Scientific Report, Feb. 2017.
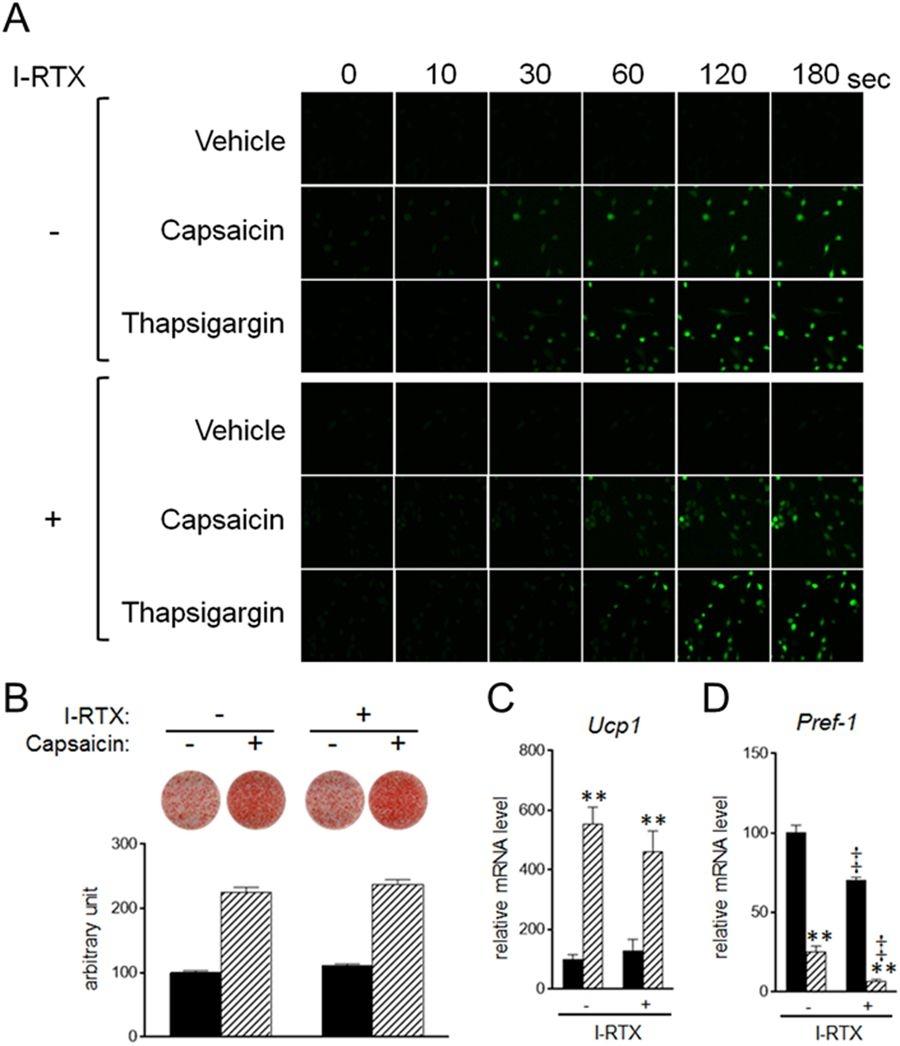
Figure 26. Stimulation of brown adipogenesis by supra-pharmacological capsaicin in a Trpv1-independent manner. (A) HB2 brown preadipocytes loaded with Fluo-8 AM were treated with capsaicin (100 μM) or A23187 (1 μM) in the absence of extracellular calcium and in the presence or absence of I-RTX (1 μM), and cytosolic calcium level was evaluated. (B–D) HB2 brown preadipocytes were cultured with 100 μM of capsaicin in the presence or absence of I-RTX (1 μM) during brown adipogenesis. (B) Oil Red O staining of cells on day 8 was performed and the dye intensity was quantified (n = 2). (C and D) Expression levels of Ucp1 (C) or Pref-1 (D) on day 8 were examined by RT-qPCR analysis. Black bar: vehicle; Hatched bar: capsaicin. The data are presented as the mean ± SE (n = 4). **P < 0.01 vs. cells treated with vehicle and corresponding reagent (vehicle or I-RTX). ‡P < 0.01 vs. cells treated with vehicle and corresponding reagent (vehicle or capsaicin). Source: Supra-pharmacological concentration of capsaicin stimulates brown adipogenesis through induction of endoplasmic reticulum stress by Kida et al., Scientific Reports, Jan. 2018.
![Activation of CB<sub>1</sub>-Rs evokes Ca<sup>2+</sup> transients in cell bodies of cultured spinal astrocytes. (a–c) Graphical representation of changes in [Ca<sup>2+</sup>]<sub>i</sub> recorded in rat cultured astrocytes following the application of 10 µM 2-AG (a), 10 µM WIN (b), and 10 µM anandamide (AEA) (c). (d) Box plot illustrating the amplitudes of calcium transients of rat cultured astrocytes in response to the application of 10 µM 2-AG, 10 µM WIN, and 10 µM AEA. Asterisks indicate significant differences between the amplitudes of calcium transients evoked by 2-AG, WIN and AEA (p = 0.0007, 2-AG vs AEA; p = 0.0354 WIN vs AEA). e: Micrographs showing the fluorescent intensity of a Fluo-8-AM-loaded cultured rat spinal astrocyte at different time points after the application of 10 µM WIN. Scale bar: 50 µm. (f–i) Graphical representations of the time courses of calcium transients evoked by the application of 10 µM WIN (f), 10 µM anandamide and 180 µM ATP (g) in cultured rat spinal astrocytes, and 10 µM WIN and 180 µM ATP in astrocytes cultured from wild type (h) and CB<sub>1</sub>-R knock out (i) mice. (j) Box plot showing the amplitudes of the calcium transients normalized to ATP responses in the responding cells cultured from rats, wild type mice, and CB<sub>1</sub>–R knock out mice. Dashed and continuous lines within the boxes represent the mean and median values of the data sets, respectively. Asterisks indicate significant difference between the amplitudes of calcium transients evoked by WIN in wild type and CB<sub>1</sub>-R knock out mice (p = 0.0118). Source: <strong>CB1 receptor activation induces intracellular Ca<sup>2+</sup> mobilization and 2-arachidonoylglycerol release in rodent spinal cord astrocytes</strong> by Hegyi et al., <em>Scientific Reports</em>, July 2018.](/_next/image?url=https%3A%2F%2Fimages.aatbio.com%2Fproducts%2Ffigures-and-data%2Ffluo-8-am%2Ffigure-for-fluo-8-am_vEYVY.jpg&w=3840&q=75)
Figure 27. Activation of CB1-Rs evokes Ca2+ transients in cell bodies of cultured spinal astrocytes. (a–c) Graphical representation of changes in [Ca2+]i recorded in rat cultured astrocytes following the application of 10 µM 2-AG (a), 10 µM WIN (b), and 10 µM anandamide (AEA) (c). (d) Box plot illustrating the amplitudes of calcium transients of rat cultured astrocytes in response to the application of 10 µM 2-AG, 10 µM WIN, and 10 µM AEA. Asterisks indicate significant differences between the amplitudes of calcium transients evoked by 2-AG, WIN and AEA (p = 0.0007, 2-AG vs AEA; p = 0.0354 WIN vs AEA). e: Micrographs showing the fluorescent intensity of a Fluo-8-AM-loaded cultured rat spinal astrocyte at different time points after the application of 10 µM WIN. Scale bar: 50 µm. (f–i) Graphical representations of the time courses of calcium transients evoked by the application of 10 µM WIN (f), 10 µM anandamide and 180 µM ATP (g) in cultured rat spinal astrocytes, and 10 µM WIN and 180 µM ATP in astrocytes cultured from wild type (h) and CB1-R knock out (i) mice. (j) Box plot showing the amplitudes of the calcium transients normalized to ATP responses in the responding cells cultured from rats, wild type mice, and CB1–R knock out mice. Dashed and continuous lines within the boxes represent the mean and median values of the data sets, respectively. Asterisks indicate significant difference between the amplitudes of calcium transients evoked by WIN in wild type and CB1-R knock out mice (p = 0.0118). Source: CB1 receptor activation induces intracellular Ca2+ mobilization and 2-arachidonoylglycerol release in rodent spinal cord astrocytes by Hegyi et al., Scientific Reports, July 2018.
![Real-time calcium imaging of <em>in situ </em>human chondrocytes. (a) Study design, 2 mm in diameter cylindrical osteochondral samples at different ICRS grades were collected form femoral condyle during arthroscopy. Samples were cut into two half-cylinders and used for calcium imaging at 4 mM and 0 mM [Ca<sup>2+</sup>]<sub>e</sub> environments. To classify calcium imaging data, histology evaluation was performed on these samples afterward. (b) Typical [Ca<sup>2+</sup>]i image series in ICRS 0 articular cartilage sample and in (c) single lacuna of the same sample. (d) A typical [Ca2+]<sub>i</sub> intensity oscillations curve of a chondrocyte and the definitions of spatiotemporal parameters. (e) Typical [Ca<sup>2+</sup>]<sub>i</sub> intensity oscillations curve in the same lacuna shown in (c) (white arrows indicated cells displayed spontaneous [Ca<sup>2+</sup>]<sub>i</sub> signal). Source: <strong>Altered spontaneous calcium signaling of <em>in situ</em> chondrocytes in human osteoarthritic cartilage</strong> by Gong et al., <em>Scientific Reports</em>, Dec. 2017.](/_next/image?url=https%3A%2F%2Fimages.aatbio.com%2Fproducts%2Ffigures-and-data%2Ffluo-8-am%2Ffigure-for-fluo-8-am_uBz8R.jpg&w=3840&q=75)
Figure 28. Real-time calcium imaging of in situ human chondrocytes. (a) Study design, 2 mm in diameter cylindrical osteochondral samples at different ICRS grades were collected form femoral condyle during arthroscopy. Samples were cut into two half-cylinders and used for calcium imaging at 4 mM and 0 mM [Ca2+]e environments. To classify calcium imaging data, histology evaluation was performed on these samples afterward. (b) Typical [Ca2+]i image series in ICRS 0 articular cartilage sample and in (c) single lacuna of the same sample. (d) A typical [Ca2+]i intensity oscillations curve of a chondrocyte and the definitions of spatiotemporal parameters. (e) Typical [Ca2+]i intensity oscillations curve in the same lacuna shown in (c) (white arrows indicated cells displayed spontaneous [Ca2+]i signal). Source: Altered spontaneous calcium signaling of in situ chondrocytes in human osteoarthritic cartilage by Gong et al., Scientific Reports, Dec. 2017.
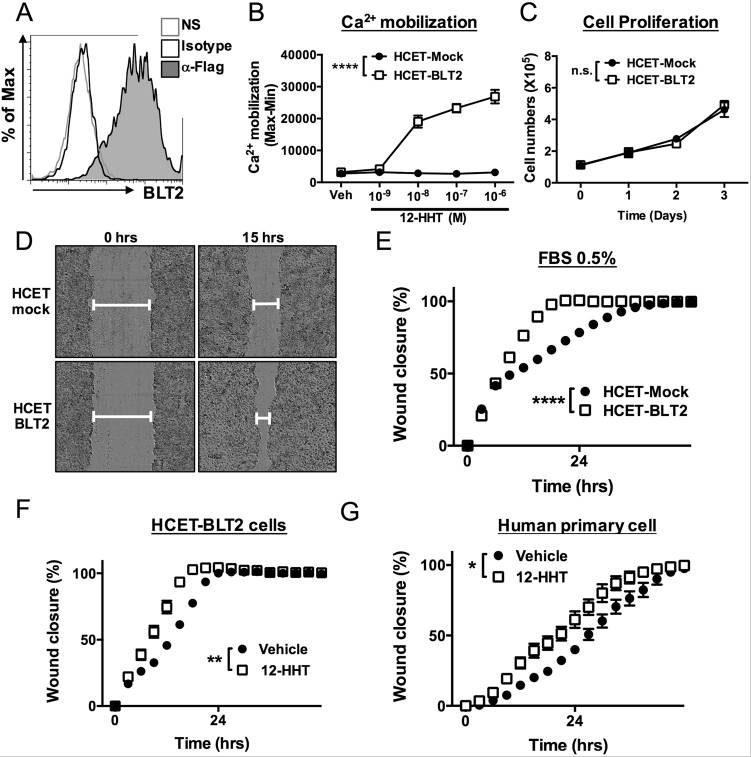
Figure 29. 12-HHT/BLT2 signaling accelerates wound closure in corneal epithelial cells in vitro. (A) Flow cytometric analysis of HCET cells stably expressing FLAG-tagged human BLT2. NS: no staining. (B) 12-HHT–dependent Ca2+ mobilization was assessed after loading of Fluo-8 AM in BLT2-overexpressing HCET cells. Error bars indicate means ± S.E. (n = 4). (C) Cell growth of HCET-Mock and HCET-BLT2 (n = 3). (D) Representative fields of HCET-Mock (upper) and HCET-BLT2 cells (bottom) at 0 and 15 hr after scratching. (E) HCET-Mock and HCET-BLT2 cells were subjected to scratch assay in medium containing 0.5% FBS. Wound area was measured and is shown as wound closure rate (%). (F) HCET cells were subjected to scratch assay in the presence of 1 µM 12-HHT. (G) Primary human corneal epithelial cells were subjected to scratch assay. 12-HHT (10 nM) was added, and the wound closure rate was measured. All data represent means ± S.E. Data were analyzed by two-way ANOVA: *p < 0.05, **p < 0.01, ****p < 0.0001; n.s.: not significant. Source: Non-steroidal anti-inflammatory drug delays corneal wound healing by reducing production of 12-hydroxyheptadecatrienoic acid, a ligand for leukotriene B4 receptor 2 by Iwamoto et al., Scientific Reports, Oct. 2017.
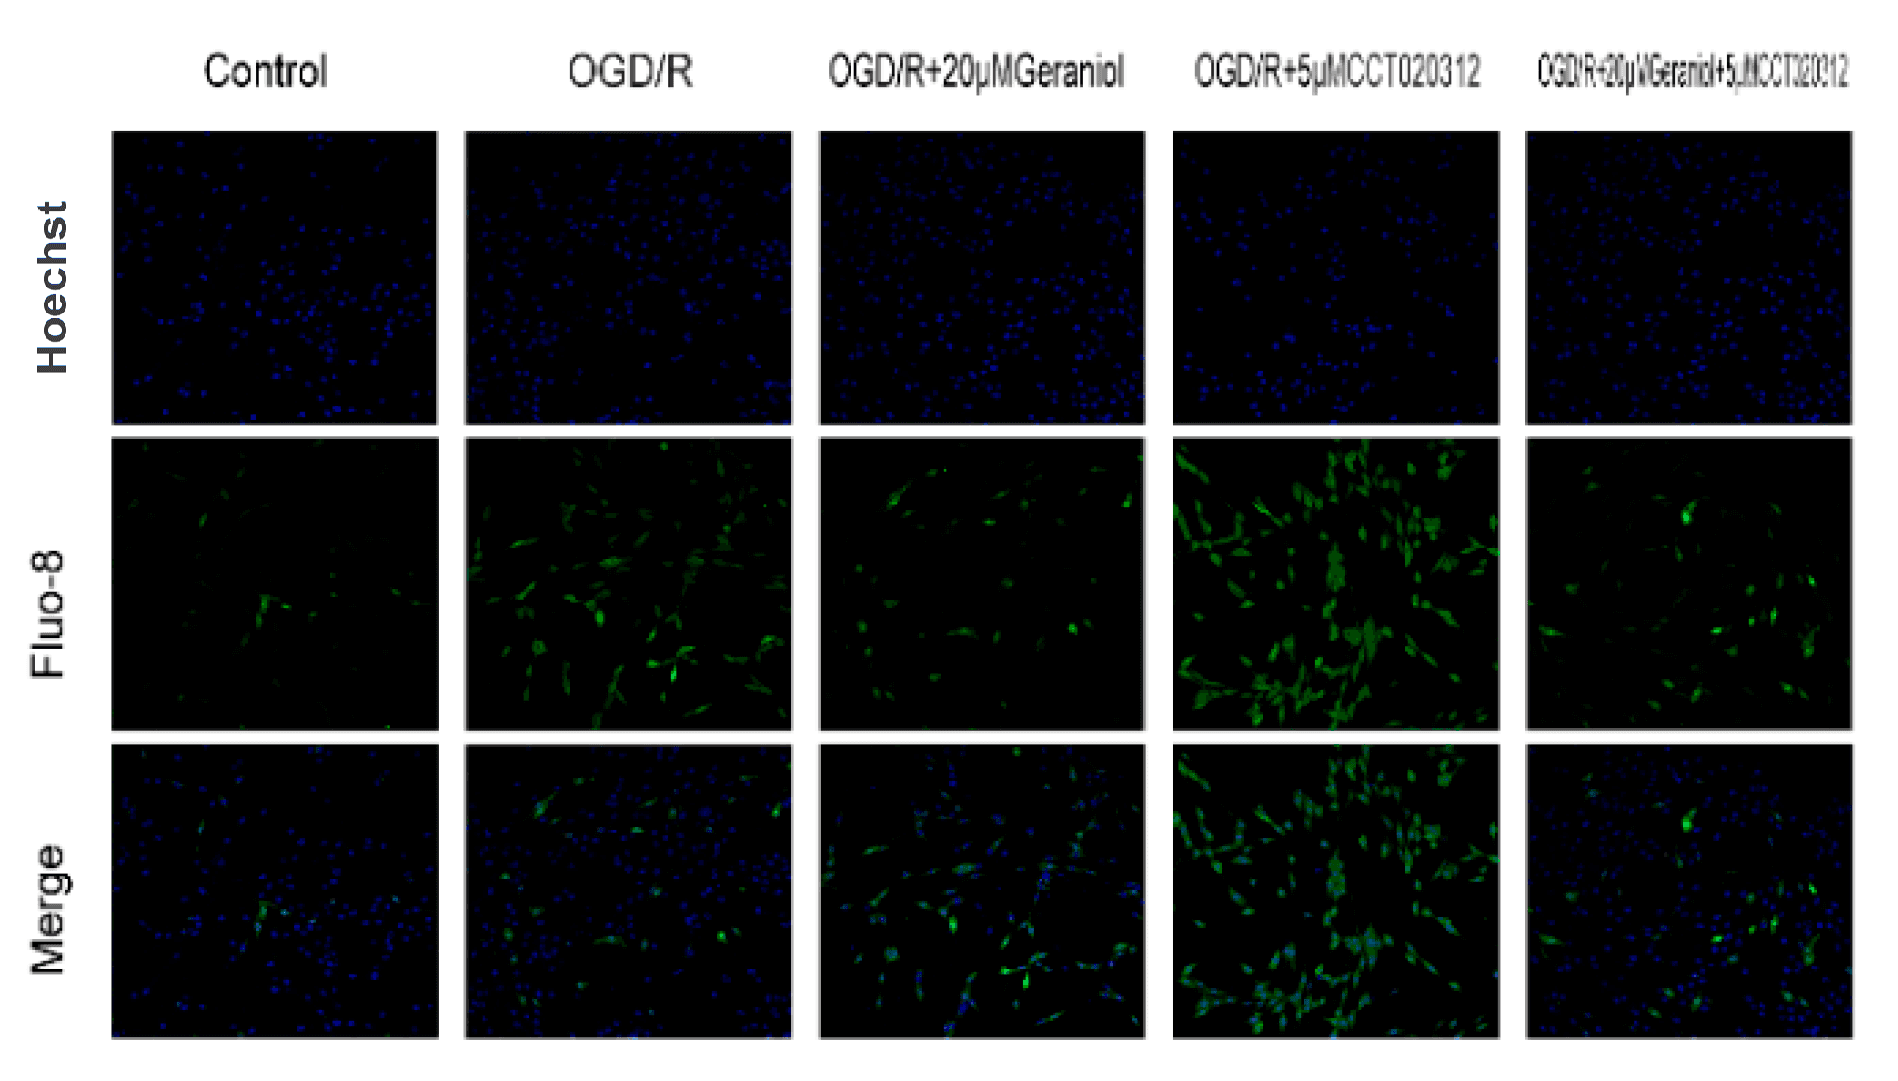
Figure 30. Inhibition of endoplasmic reticulum stress via the PERK-ATF4-CHOP pathway is required for the geraniol-mediated protective effect against oxygen–glucose deprivation/reoxygenation (OGD/R) injury in PC12 cells. The intracellular calcium ion concentration was detected via Fluo-8/AM staining using laser confocal microscopy. Bar = 200 μm. Source: Geraniol-Mediated Suppression of Endoplasmic Reticulum Stress Protects against Cerebral Ischemia–Reperfusion Injury via the PERK-ATF4-CHOP Pathway. by Wu, Y.; Fan, X.; Chen, S.; Deng, L.; Jiang, L.; Yang, S.; Dong, Z. Int. J. Mol. Sci. Dec. 2023.
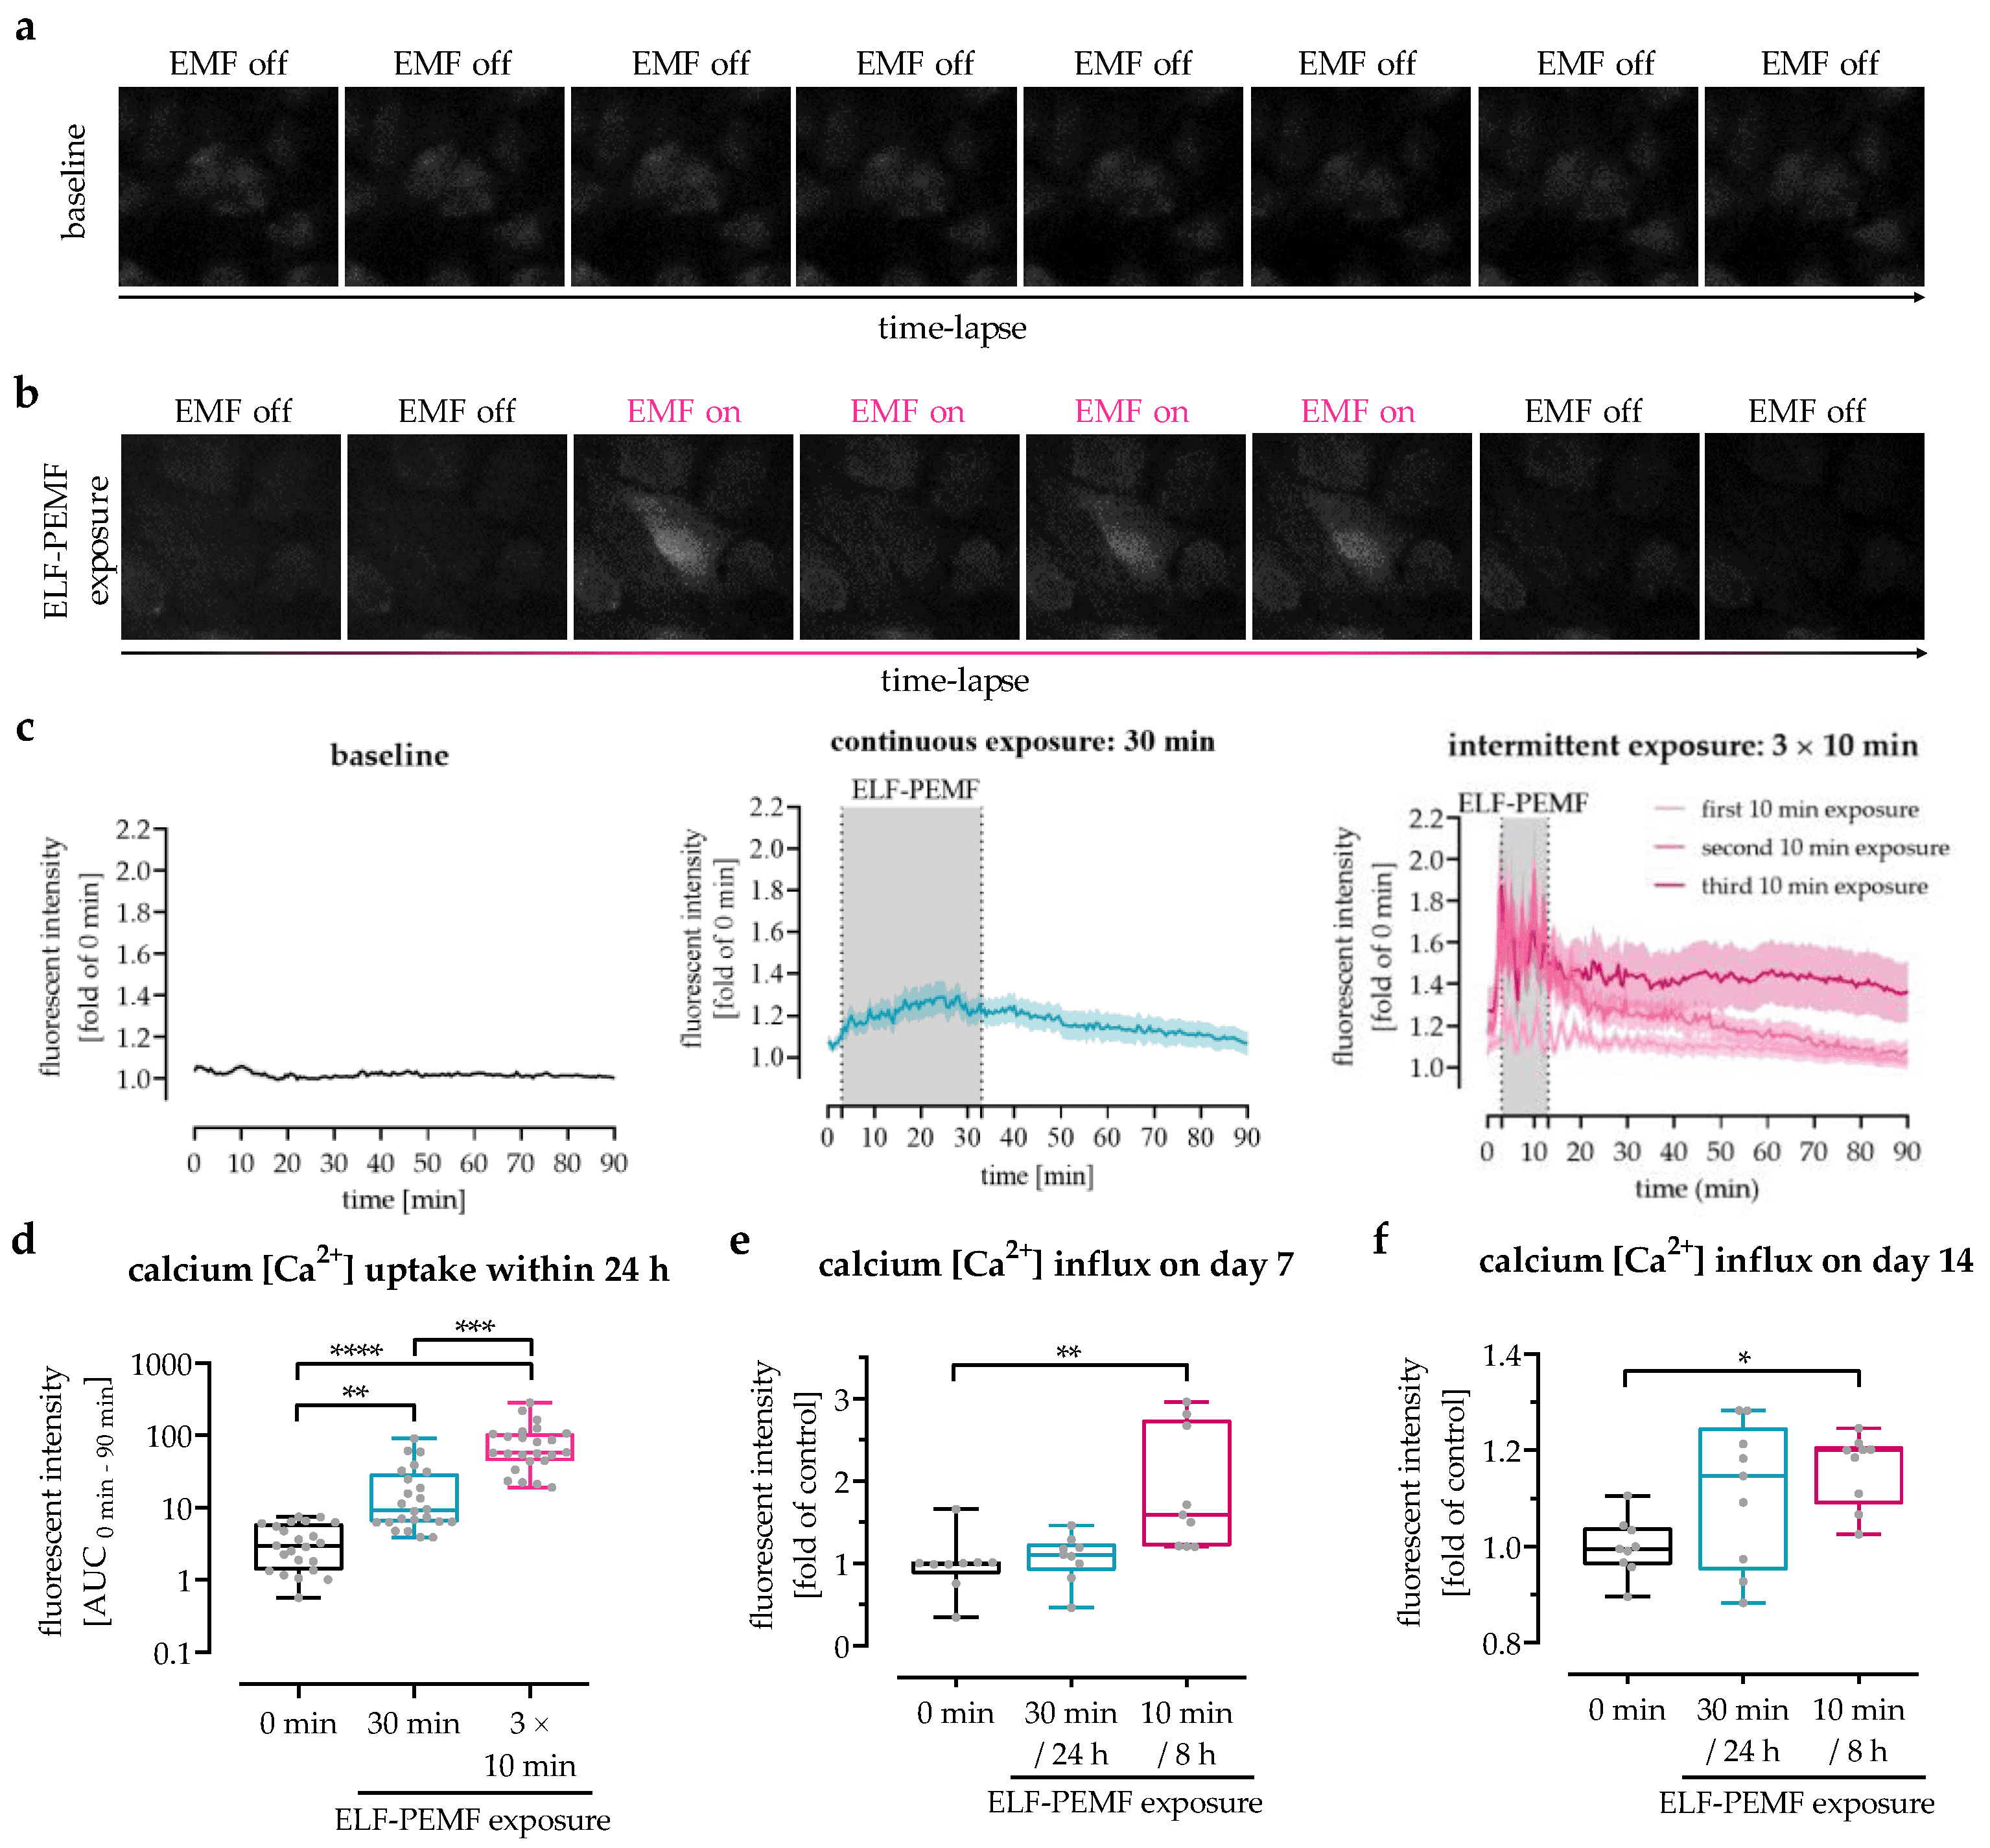
Figure 31. Analysis of 16 Hz ELF-PEMF-dependent Ca2+ influx into SCP-1 cells. Intracellular calcium levels were detected using the fluorescent probe Fluo-8. Time-lapse fluorescent image series of Fluo-8-loaded SCP-1 cells (a) without or (b) with 16 Hz ELF-PEMF exposure. (c) Automated image analysis using the time series analyzer V3 plugin of ImageJ software was used to determine intracellular Ca2+ levels over time. (d) Area under the curve (AUC) was used to determine the net-Ca2+ uptake within the first 24 h. Ca2+ influx into SCP-1 cells, osteogenically differentiated for (e) 7 and (f) 14 days with or without daily exposure to 16 Hz ELF-PEMF, was quantified at λex = 495 nm and λem = 516 nm using a microplate reader, 2 min immediately after starting the ELF-PEMF exposure. N = 3, n ≥ 3. Data are displayed as line graphs with error bands or box plots with individual data points. Data were analyzed by non-parametric one-way ANOVA followed by Friedman’s multiple comparison test, * p < 0.05, ** p < 0.01, *** p < 0.001, and **** p < 0.0001. Source: Intermittent Exposure to a 16 Hz Extremely Low Frequency Pulsed Electromagnetic Field Promotes Osteogenesis In Vitro through Activating Piezo 1-Induced Ca2+ Influx in Osteoprogenitor Cells by Chen, Yangmengfan et.al. Journal of Functional Biomaterials, March 2023.
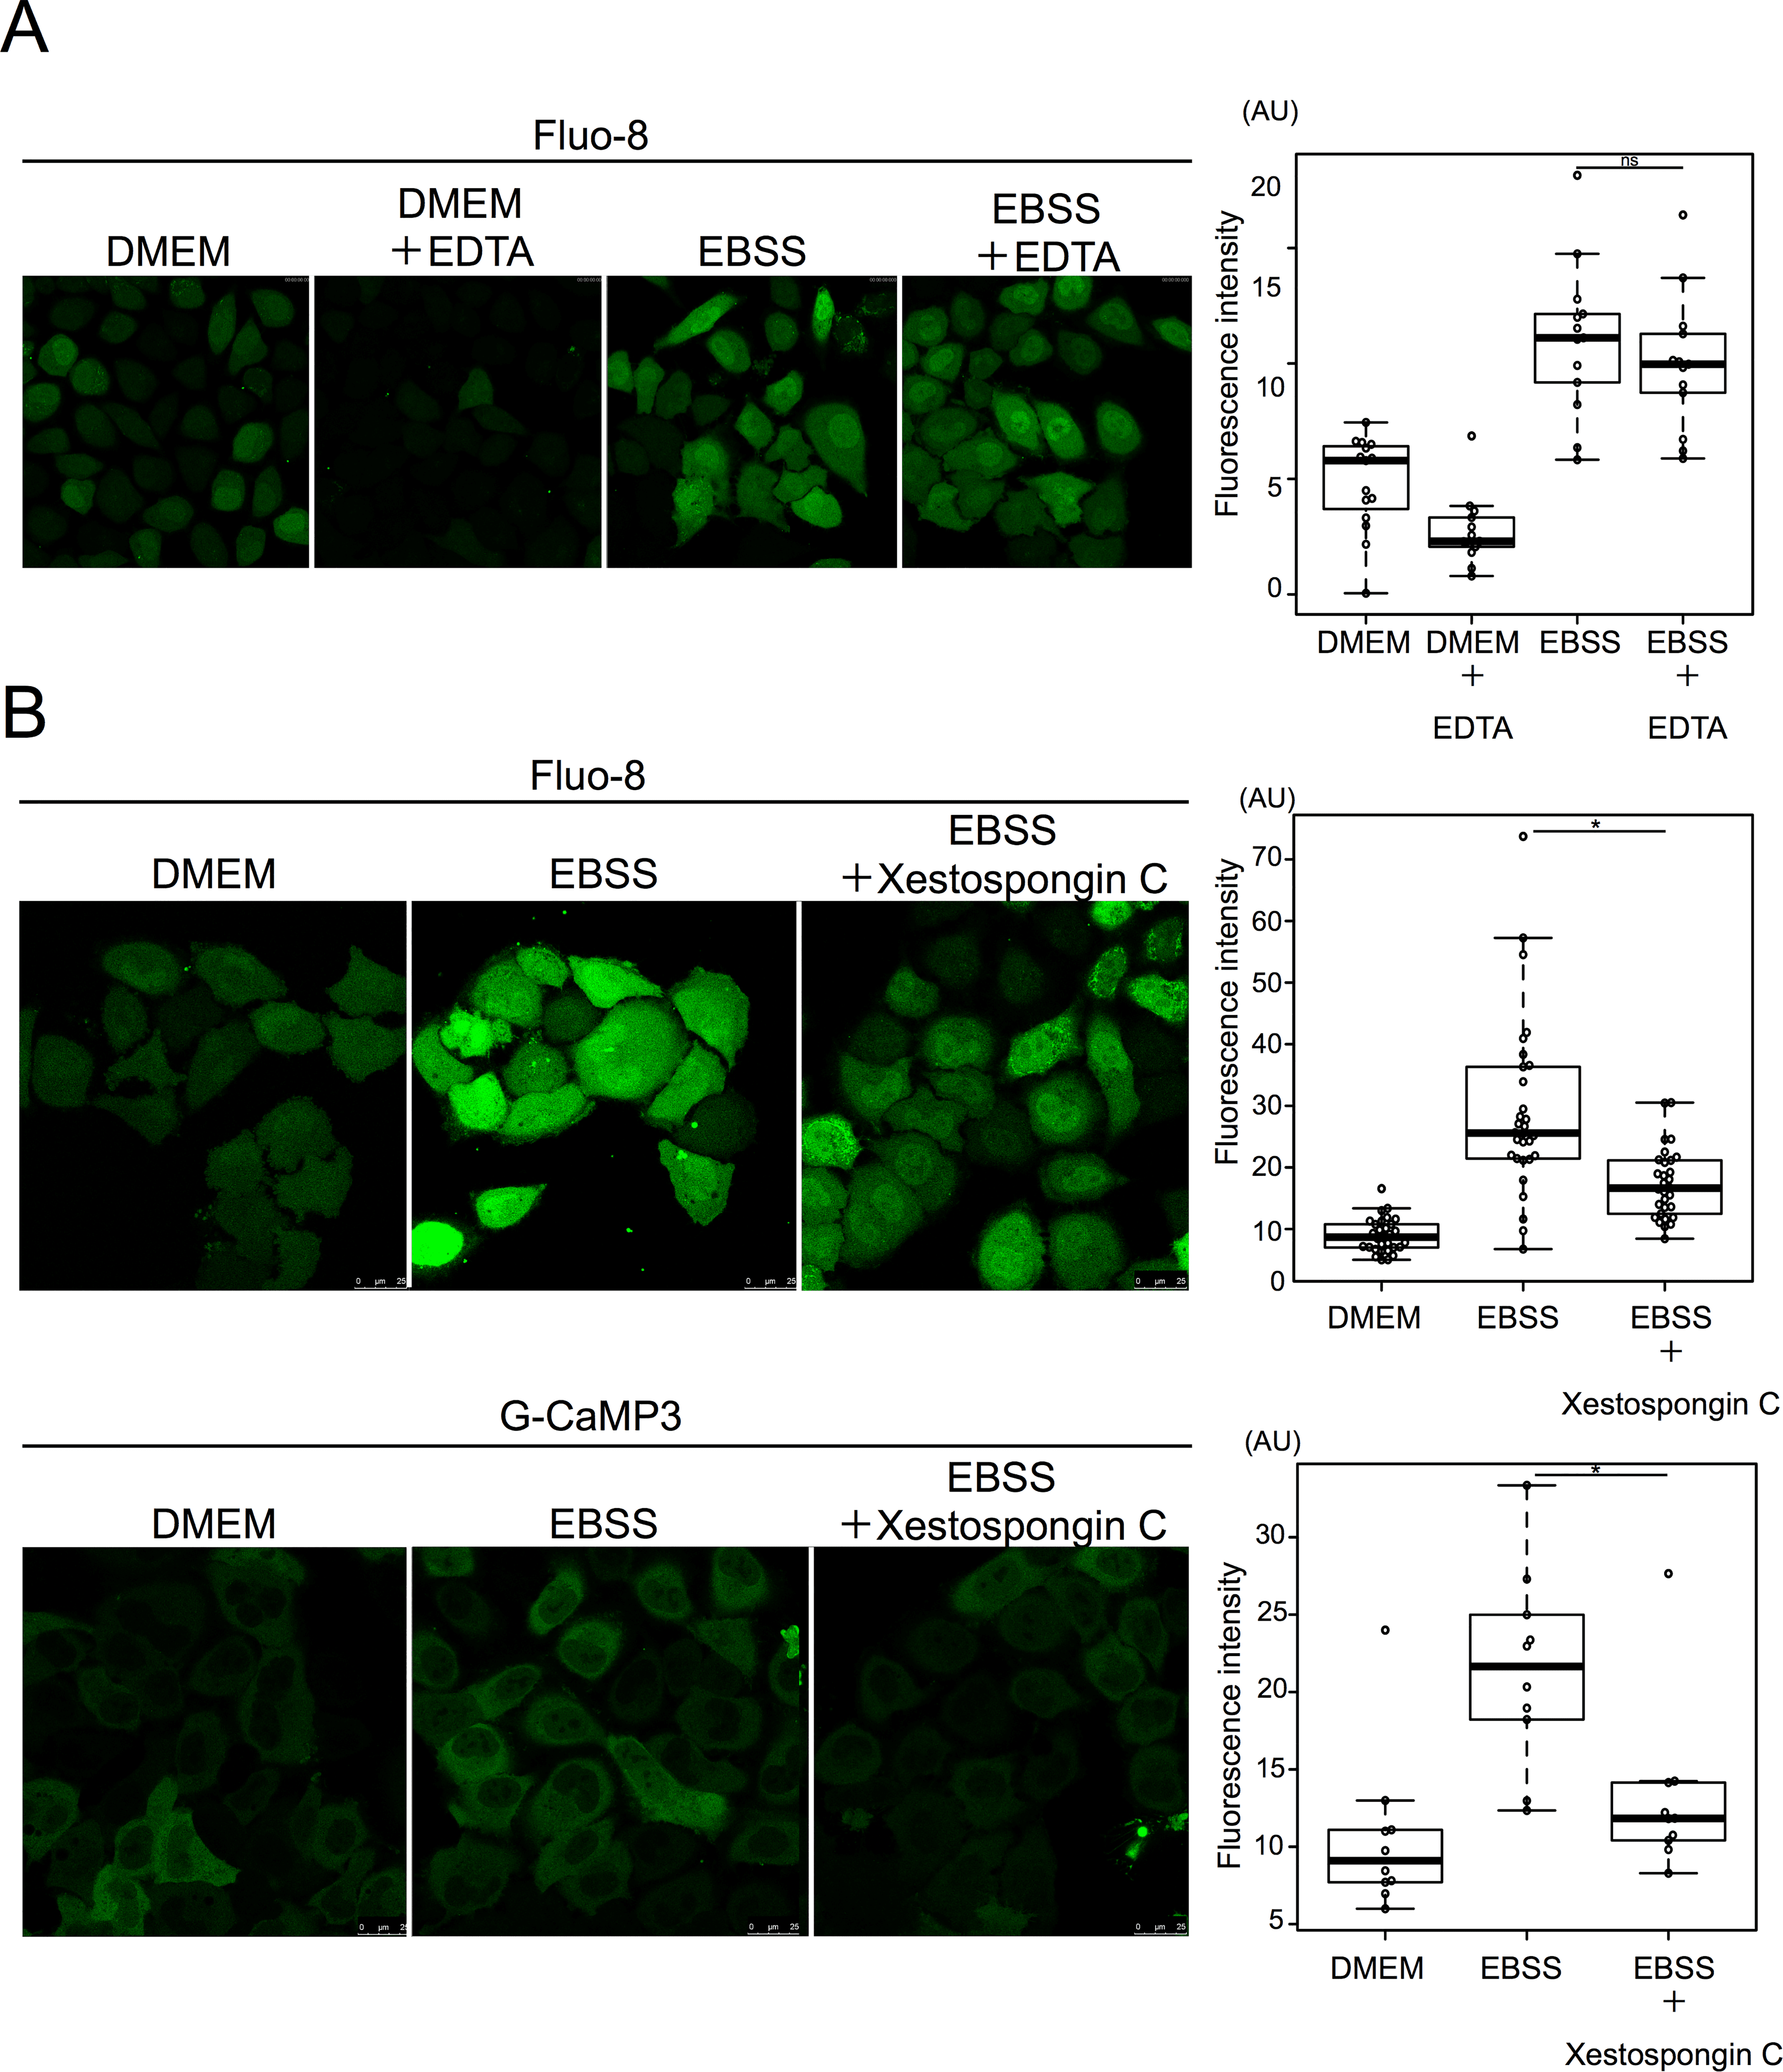
Figure 32. Starvation induced calcium efflux from the ER mediated by the IP3 receptor. A. HeLa cells were cultured with 0.5 mM EDTA in EBSS for 90 min and then stained with Fluo-8 for 30 min. 15 cells were counted in three independent experiments. B. HeLa cells were treated with or without xestospongin C in DMEM or EBSS for 90 min, and then stained with Fluo-8 for 30 min. 15 cells were counted in three independent experiments. HeLa cells were transiently transfected with G-CaMP3 and shifted to DMEM or EBSS with or without xestospongin C for 2 h. 30 cells were counted in three independent experiments. Fluorescence intensity was measured in ROI within cytoplasm. Median: line; upper and lower quartiles: boxes; 1.5-interquartile range: whiskers. * denotes p<0.05 (unpaired two-tailed Student’s t-test) between EBSS and EBSS plus drug treatment. Source: Starvation-induced autophagy via calcium-dependent TFEB dephosphorylation is suppressed by Shigyakusan by Ikari S, Lu S-L, Hao F, Imai K, Araki Y, Yamamoto Y-h, et al. PLoS ONE 15(3): e0230156. June 2023.


![Relationship of Ca<sup>2+</sup> dynamics with electrical stimulation frequency. Relative changes in fluorescence intensity ((ΔF/F0)×100%) for leg muscle of (A) beetle orally dosed with Fluo-8 (blue) and Cell Tracker (red) and (B) control beetle measured with the filter setting used for Fluo-8 (blue) and Cell Tracker (red) under varying electrical stimulations (1 Hz, 10 Hz, 50 Hz, and 100 Hz; 10% duty cycle; 2 V). Data were analyzed from the ROI adjacent to the stimulated site (S1B Fig.). The error bars represent the S.D. (N = 8 beetles, n = 24 beetle legs for (A); N = 2 beetles, n = 8 beetle legs for (B)). The small numbers next to each plot indicate the order of stimulation. Cell Tracker data set was compared with Fluo-8 data set at each stimulation frequency evaluated by student’s t-test both for dosed beetles in (A) (1st 50 Hz, p = 9.37×10⁻⁴; 10 Hz, p = 7.45×10⁻³; 1st 1 Hz, p = 2.30×10⁻¹; 100 Hz, p = 4.17×10⁻⁴; 2nd 1 Hz, p = 4.49×10⁻²; and 2nd 50 Hz, p = 8.16×10⁻³) and for control beetles in (B) (1st 50 Hz, p = 4.10×10⁻¹; 10 Hz, p = 9.30×10⁻¹; 1st 1 Hz, p = 9.29×10⁻¹; 100 Hz, p = 5.69×10⁻²; 2nd 1 Hz, p = 6.85×10⁻¹; and 2nd 50 Hz, p = 2.67×10⁻²). The significant differences are displayed by an asterisk (p < 0.05). Fluo-8 intensity dynamics show that Ca<sup>2+</sup> dynamics inside the muscle have a positive correlation with electrical stimulation frequency; i.e., higher stimulation frequency induces larger increase in [Ca<sup>2+</sup>]. On the other hand, Cell Tracker intensity dynamics show that the frequency-dependent intensity change due to muscle displacement is not apparent. Source: Graph from <strong>Oral Dosing of Chemical Indicators for <em>In Vivo</em> Monitoring of Ca<sup>2+</sup> Dynamics in Insect Muscle</strong> by Ferdinandus et al., <em>PLOS</em>, Jan. 2015.](/_next/image?url=https%3A%2F%2Fimages.aatbio.com%2Fproducts%2Ffigures-and-data%2Ffluo-8-am%2Ffigure-for-fluo-8-am_EQOEG.jpg&w=128&q=25)


![Relationship of Ca<sup>2+</sup> dynamics with electrical stimulation frequency. Relative changes in fluorescence intensity ((ΔF/F0)×100%) for leg muscle of (A) beetle orally dosed with Fluo-8 (blue) and Cell Tracker (red) and (B) control beetle measured with the filter setting used for Fluo-8 (blue) and Cell Tracker (red) under varying electrical stimulations (1 Hz, 10 Hz, 50 Hz, and 100 Hz; 10% duty cycle; 2 V). Data were analyzed from the ROI adjacent to the stimulated site (S1B Fig.). The error bars represent the S.D. (N = 8 beetles, n = 24 beetle legs for (A); N = 2 beetles, n = 8 beetle legs for (B)). The small numbers next to each plot indicate the order of stimulation. Cell Tracker data set was compared with Fluo-8 data set at each stimulation frequency evaluated by student’s t-test both for dosed beetles in (A) (1st 50 Hz, p = 9.37×10⁻⁴; 10 Hz, p = 7.45×10⁻³; 1st 1 Hz, p = 2.30×10⁻¹; 100 Hz, p = 4.17×10⁻⁴; 2nd 1 Hz, p = 4.49×10⁻²; and 2nd 50 Hz, p = 8.16×10⁻³) and for control beetles in (B) (1st 50 Hz, p = 4.10×10⁻¹; 10 Hz, p = 9.30×10⁻¹; 1st 1 Hz, p = 9.29×10⁻¹; 100 Hz, p = 5.69×10⁻²; 2nd 1 Hz, p = 6.85×10⁻¹; and 2nd 50 Hz, p = 2.67×10⁻²). The significant differences are displayed by an asterisk (p < 0.05). Fluo-8 intensity dynamics show that Ca<sup>2+</sup> dynamics inside the muscle have a positive correlation with electrical stimulation frequency; i.e., higher stimulation frequency induces larger increase in [Ca<sup>2+</sup>]. On the other hand, Cell Tracker intensity dynamics show that the frequency-dependent intensity change due to muscle displacement is not apparent. Source: Graph from <strong>Oral Dosing of Chemical Indicators for <em>In Vivo</em> Monitoring of Ca<sup>2+</sup> Dynamics in Insect Muscle</strong> by Ferdinandus et al., <em>PLOS</em>, Jan. 2015.](https://images.aatbio.com/products/figures-and-data/fluo-8-am/figure-for-fluo-8-am_EQOEG.jpg)

![Effects of ACO on [Ca<sup>2+</sup>]i transients in hiPSC-CMs. (A) Representative traces of the [Ca<sup>2+</sup>]i transients recorded in a hiPSC-CM at baseline and with subsequent exposure of ACO and ACO plus Bay K-8644. (B, C, and D) Bar-graphs show the changes in [Ca<sup>2+</sup>]i transient frequency, duration and amplitude in hiPSC-CMs. †p < 0.01, vs. baseline. ‡ p < 0.001, vs. ACO. n = 7. *[Ca<sup>2+</sup>]i transients were recorded in hiPSC-CMs using a LSM-710 laser-scanning confocal microscope (Carl Zeiss, Inc, Germany) with a 40×, 1.3 numerical aperture oil immersion objective and axial resolutions of 1.5 μm. Briefly, hiPSC-CMs were loaded with 2 μM Fluo-8 AM (AAT Bioquest, Inc. Sunnyvale, CA, USA) for 15 min at 37°C, and recorded in normal Tyrode’s solution. Source: Graph from <strong>L-Type Calcium Channel Inhibition Contributes to the Proarrhythmic Effects of Aconitine in Human Cardiomyocytes</strong> by Jianjun Wu et al., <em>PLOS ONE</em>, Jan. 2017. ](https://images.aatbio.com/products/figures-and-data/fluo-8-am/figure-for-fluo-8-am_VPsrM.jpg)


![Effect of Glucose and 3-O-Methylglucose on [Ca2+]c Measured by Fluo-8. A: Fluo-8-loaded cells were stimulated by 25 mM glucose and changes in [Ca2+]c were measured. A typical response with a rapid peak is presented. The trace is a respresentative of those-obtained in more than 100 cells. B: Fluo-8-loaded cells were incubated in Ca2+-free HBSS and stimulated by 25 mM glucose as shown by the arrow. The trace is a representative of those obtained in more than 100 cells. C: Fluo-8-loaded cells were stimulated by 25 mM glucose in the presence of 1 μM nifedipine, which was added 10 min pror to the stimulation by glucose. Changes in [Ca2+]c were monitored. The trace is a representative of those obtained in more than 100 cells. D: Fluo-8-loaded cells preincubated for 10 min with 10 mM mannoheptulose were stimulated with 25 mM glucose as indicated by the arrow. The trace is a representative of those obtained in more than 100 cells. E: Fluo-8-loaded cells were stimulated by 25 mM 3-O-methylglucose and changes in [Ca2+]c were monitored. The trace is a representative of those obtained in more than 100 cells. F: Fluo-8-loaded cells were stimulated by 25 mM glucose in the presence of 5 mM lactisole, which was added 10 min prior to the stimulation by glucose. Changes in [Ca2+]c were monitored. The trace is a representative of those obtained in more than 100 cells. G: Experiments were carried out as shown in F and AUC from 1 to 5 min was calculated. Values are the mean ± SE for 10 determinations. Source: <em>Graph from Glucose Evokes Rapid Ca2+ and Cyclic AMP Signals</em> <em>by Activating the Cell-Surface Glucose-Sensing Receptor in Pancreatic β-Cells</em> by Yuko Nakagawa et al. PLOS, Dec. 2015.](https://images.aatbio.com/products/figures-and-data/fluo-8-am/figure-for-fluo-8-am_LDtwg.jpg)
![Bupivacaine treatment leads to an increase in cytosolic Ca2+ ([Ca2+]i). SH-SY5Y cells were either pretreated with the indicated concentrations of NNC 55-0396 dihydrochloride or left untreated prior to 1 mM bupivaine treatment for 24 h. [Ca2+]i levels were measured by Quest Fluo-8 AM ester (mean±SD, n?=?6)). A: Representative image of Quest Fluo-8 AM ester flow cytometry analysis. Source: Graph from Neurotoxicity Induced by Bupivacaine via T-Type Calcium Channels in SH-SY5Y Cells by Xianjie Wen et al., PLOS, May 2013.](https://images.aatbio.com/products/figures-and-data/fluo-8-am/figure-for-fluo-8-am_2P54h.jpg)


![Activation of CB<sub>1</sub>-Rs evokes Ca<sup>2+</sup> transients in cell bodies of cultured spinal astrocytes. (a–c) Graphical representation of changes in [Ca<sup>2+</sup>]<sub>i</sub> recorded in rat cultured astrocytes following the application of 10 µM 2-AG (a), 10 µM WIN (b), and 10 µM anandamide (AEA) (c). (d) Box plot illustrating the amplitudes of calcium transients of rat cultured astrocytes in response to the application of 10 µM 2-AG, 10 µM WIN, and 10 µM AEA. Asterisks indicate significant differences between the amplitudes of calcium transients evoked by 2-AG, WIN and AEA (p = 0.0007, 2-AG vs AEA; p = 0.0354 WIN vs AEA). e: Micrographs showing the fluorescent intensity of a Fluo-8-AM-loaded cultured rat spinal astrocyte at different time points after the application of 10 µM WIN. Scale bar: 50 µm. (f–i) Graphical representations of the time courses of calcium transients evoked by the application of 10 µM WIN (f), 10 µM anandamide and 180 µM ATP (g) in cultured rat spinal astrocytes, and 10 µM WIN and 180 µM ATP in astrocytes cultured from wild type (h) and CB<sub>1</sub>-R knock out (i) mice. (j) Box plot showing the amplitudes of the calcium transients normalized to ATP responses in the responding cells cultured from rats, wild type mice, and CB<sub>1</sub>–R knock out mice. Dashed and continuous lines within the boxes represent the mean and median values of the data sets, respectively. Asterisks indicate significant difference between the amplitudes of calcium transients evoked by WIN in wild type and CB<sub>1</sub>-R knock out mice (p = 0.0118). Source: <strong>CB1 receptor activation induces intracellular Ca<sup>2+</sup> mobilization and 2-arachidonoylglycerol release in rodent spinal cord astrocytes</strong> by Hegyi et al., <em>Scientific Reports</em>, July 2018.](https://images.aatbio.com/products/figures-and-data/fluo-8-am/figure-for-fluo-8-am_vEYVY.jpg)
![Real-time calcium imaging of <em>in situ </em>human chondrocytes. (a) Study design, 2 mm in diameter cylindrical osteochondral samples at different ICRS grades were collected form femoral condyle during arthroscopy. Samples were cut into two half-cylinders and used for calcium imaging at 4 mM and 0 mM [Ca<sup>2+</sup>]<sub>e</sub> environments. To classify calcium imaging data, histology evaluation was performed on these samples afterward. (b) Typical [Ca<sup>2+</sup>]i image series in ICRS 0 articular cartilage sample and in (c) single lacuna of the same sample. (d) A typical [Ca2+]<sub>i</sub> intensity oscillations curve of a chondrocyte and the definitions of spatiotemporal parameters. (e) Typical [Ca<sup>2+</sup>]<sub>i</sub> intensity oscillations curve in the same lacuna shown in (c) (white arrows indicated cells displayed spontaneous [Ca<sup>2+</sup>]<sub>i</sub> signal). Source: <strong>Altered spontaneous calcium signaling of <em>in situ</em> chondrocytes in human osteoarthritic cartilage</strong> by Gong et al., <em>Scientific Reports</em>, Dec. 2017.](https://images.aatbio.com/products/figures-and-data/fluo-8-am/figure-for-fluo-8-am_uBz8R.jpg)


