Cal-770™, potassium salt
Calcium measurement is critical for numerous biological investigations. Fluorescent probes that show spectral responses upon binding calcium have enabled researchers to investigate changes in intracellular free calcium concentrations by using fluorescence microscopy, flow cytometry, fluorescence spectroscopy and fluorescence microplate readers. Cal-770™ is a near infrared (NIR) calcium indicator with maximum emission at ~775 nm. It is the only fluorescent calcium indicator with excitation and emission longer than 700 nm with a moderate calcium affinity of Kd ~850 nM. Cal-770™ is one of the very few calcium indicators that can be potentially used for in vivo imaging since it has a NIR fluorescence.
Example protocol
SAMPLE EXPERIMENTAL PROTOCOL
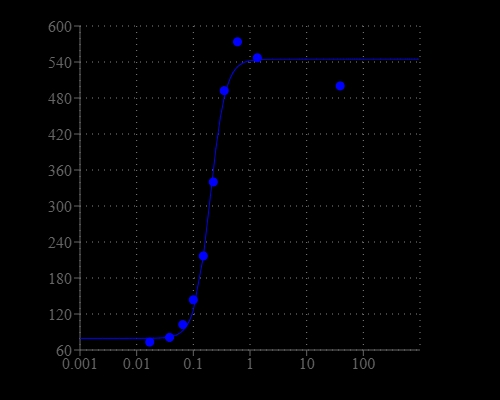
Calcium calibration can be carried out by measuring the fluorescence intensity of the salt form (25 to 50 µM in fluorescence microplate readers) of the indicators in solutions with precisely known free Ca2+ concentrations. Calibration solutions can be used based on 30 mM MOPS EGTA Ca2+ buffer. In general, water contains trace amount of calcium ion. It is highly recommended to use 30 mM MOPS + 100 mM KCl, pH 7.2 as buffer system. One can simply make a 0 and 39 µM calcium stock solutions as listed below, and these 2 solutions are used to make a serial solution of different Ca2+ concentrations.
A: 0 µM calcium: 30 mM MOPS + 100 mM KCl, pH 7.2 buffer + 10 mM EGTA
B: 39 µM calcium: 30 mM MOPS + 100 mM KCl, pH 7.2 buffer + 10 mM EGTA + 10 mM CaCl2
To determine either the free calcium concentration of a solution or the Kd of a single-wavelength calcium indicator, the following equation is used:
[Ca]Free = Kd [F - Fmin] / [Fmax - F]
Where F is the fluorescence intensity of the indicator at a specific experimental calcium level, Fmin is the fluorescence intensity in the absence of calcium and Fmax is the fluorescence intensity of the calciumsaturated probe.
The dissociation constant (Kd) is a measure of the affinity of the probe for calcium. The calcium-binding and spectroscopic properties of fluorescent indicators vary quite significantly in cellular environments compared to calibration solutions. In situ response calibrations of intracellular indicators typically yield Kd values significantly higher than in vitro determinations. In situ calibrations are performed by exposing loaded cells to controlled Ca2+ buffers in the presence of ionophores such as A-23187, 4-bromo A-23187 and ionomycin. Alternatively, cell permeabilization agents such as digitonin or Triton® X-100 can be used to expose the indicator to the controlled Ca2+ levels of the extracellular medium. The fluorescence can be measured at Ex/Em = 750/790 nm.
Calculators
Common stock solution preparation
Table 1. Volume of Water needed to reconstitute specific mass of Cal-770™, potassium salt to given concentration. Note that volume is only for preparing stock solution. Refer to sample experimental protocol for appropriate experimental/physiological buffers.
0.1 mg | 0.5 mg | 1 mg | 5 mg | 10 mg | |
1 mM | 59.221 µL | 296.107 µL | 592.214 µL | 2.961 mL | 5.922 mL |
5 mM | 11.844 µL | 59.221 µL | 118.443 µL | 592.214 µL | 1.184 mL |
10 mM | 5.922 µL | 29.611 µL | 59.221 µL | 296.107 µL | 592.214 µL |
Molarity calculator
Enter any two values (mass, volume, concentration) to calculate the third.
Mass (Calculate) | Molecular weight | Volume (Calculate) | Concentration (Calculate) | Moles | ||||
/ | = | x | = |
Spectrum
Open in Advanced Spectrum Viewer
Product family
Name | Excitation (nm) | Emission (nm) | Quantum yield |
Cal-590™, potassium salt | 574 | 588 | 0.621 |
Cal-630™, potassium salt | 609 | 626 | 0.371 |
Cal-520®, potassium salt | 492 | 515 | 0.751 |
Cal-520FF™, potassium salt | 492 | 515 | 0.751 |
Cal-520N™, potassium salt | 492 | 515 | 0.751 |
Cal-500™, potassium salt | 388 | 482 | 0.481 |
Cal-670™, potassium salt | 667 | 680 | - |
Cal-520ER™ potassium salt | 492 | 515 | - |
Citations
View all 10 citations: Citation Explorer
Calreticulin regulates TGF-β1-induced epithelial mesenchymal transition through modulating Smad signaling and calcium signaling
Authors: Wu, Yanjiao and Xu, Xiaoli and Ma, Lunkun and Yi, Qian and Sun, Weichao and Tang, Liling
Journal: The International Journal of Biochemistry & Cell Biology (2017)
Authors: Wu, Yanjiao and Xu, Xiaoli and Ma, Lunkun and Yi, Qian and Sun, Weichao and Tang, Liling
Journal: The International Journal of Biochemistry & Cell Biology (2017)
Monosialoganglioside 1 may alleviate neurotoxicity induced by propofol combined with remifentanil in neural stem cells
Authors: Lu, Jiang and Yao, Xue-qin and Luo, Xin and Wang, Yu and Chung, Sookja Kim and Tang, He-xin and Cheung, Chi Wai and Wang, Xian-yu and Meng, Chen and Li, Qing and others, undefined
Journal: Neural Regeneration Research (2017): 945
Authors: Lu, Jiang and Yao, Xue-qin and Luo, Xin and Wang, Yu and Chung, Sookja Kim and Tang, He-xin and Cheung, Chi Wai and Wang, Xian-yu and Meng, Chen and Li, Qing and others, undefined
Journal: Neural Regeneration Research (2017): 945
Obtaining spontaneously beating cardiomyocyte-like cells from adipose-derived stromal vascular fractions cultured on enzyme-crosslinked gelatin hydrogels
Authors: Yang, Gang and Xiao, Zhenghua and Ren, Xiaomei and Long, Haiyan and Ma, Kunlong and Qian, Hong and Guo, Yingqiang
Journal: Scientific Reports (2017): 41781
Authors: Yang, Gang and Xiao, Zhenghua and Ren, Xiaomei and Long, Haiyan and Ma, Kunlong and Qian, Hong and Guo, Yingqiang
Journal: Scientific Reports (2017): 41781
Dexmedetomidine reduces hypoxia/reoxygenation injury by regulating mitochondrial fission in rat hippocampal neurons
Authors: Liu, Jia and Du, Qing and Zhu, He and Li, Yu and Liu, Maodong and Yu, Shoushui and Wang, Shilei
Journal: Int J Clin Exp Med (2017): 6861--6868
Authors: Liu, Jia and Du, Qing and Zhu, He and Li, Yu and Liu, Maodong and Yu, Shoushui and Wang, Shilei
Journal: Int J Clin Exp Med (2017): 6861--6868
Di (2-ethylhexyl) phthalate-induced apoptosis in rat INS-1 cells is dependent on activation of endoplasmic reticulum stress and suppression of antioxidant protection
Authors: Sun, Xia and Lin, Yi and Huang, Qiansheng and Shi, Junpeng and Qiu, Ling and Kang, Mei and Chen, Yajie and Fang, Chao and Ye, Ting and Dong, Sijun
Journal: Journal of cellular and molecular medicine (2015): 581--594
Authors: Sun, Xia and Lin, Yi and Huang, Qiansheng and Shi, Junpeng and Qiu, Ling and Kang, Mei and Chen, Yajie and Fang, Chao and Ye, Ting and Dong, Sijun
Journal: Journal of cellular and molecular medicine (2015): 581--594
References
View all 53 references: Citation Explorer
A flow cytometric comparison of Indo-1 to fluo-3 and Fura Red excited with low power lasers for detecting Ca(2+) flux
Authors: Bailey S, Macardle PJ.
Journal: J Immunol Methods (2006): 220
Authors: Bailey S, Macardle PJ.
Journal: J Immunol Methods (2006): 220
Functional fluo-3/AM assay on P-glycoprotein transport activity in L1210/VCR cells by confocal microscopy
Authors: Orlicky J, Sulova Z, Dovinova I, Fiala R, Zahradnikova A, Jr., Breier A.
Journal: Gen Physiol Biophys (2004): 357
Authors: Orlicky J, Sulova Z, Dovinova I, Fiala R, Zahradnikova A, Jr., Breier A.
Journal: Gen Physiol Biophys (2004): 357
Comparison of human recombinant adenosine A2B receptor function assessed by Fluo-3-AM fluorometry and microphysiometry
Authors: Patel H, Porter RH, Palmer AM, Croucher MJ.
Journal: Br J Pharmacol (2003): 671
Authors: Patel H, Porter RH, Palmer AM, Croucher MJ.
Journal: Br J Pharmacol (2003): 671
Measurement of the dissociation constant of Fluo-3 for Ca2+ in isolated rabbit cardiomyocytes using Ca2+ wave characteristics
Authors: Loughrey CM, MacEachern KE, Cooper J, Smith GL.
Journal: Cell Calcium (2003): 1
Authors: Loughrey CM, MacEachern KE, Cooper J, Smith GL.
Journal: Cell Calcium (2003): 1
Kinetics of onset of mouse sperm acrosome reaction induced by solubilized zona pellucida: fluorimetric determination of loss of pH gradient between acrosomal lumen and medium monitored by dapoxyl (2-aminoethyl) sulfonamide and of intracellular Ca(2+) chang
Authors: Rockwell PL, Storey BT.
Journal: Mol Reprod Dev (2000): 335
Authors: Rockwell PL, Storey BT.
Journal: Mol Reprod Dev (2000): 335
Page updated on October 9, 2024