logo
AAT Bioquest

Cell Meter™ Apoptotic and Necrotic Multiplexing Detection Kit II *Triple Fluorescence Colors*

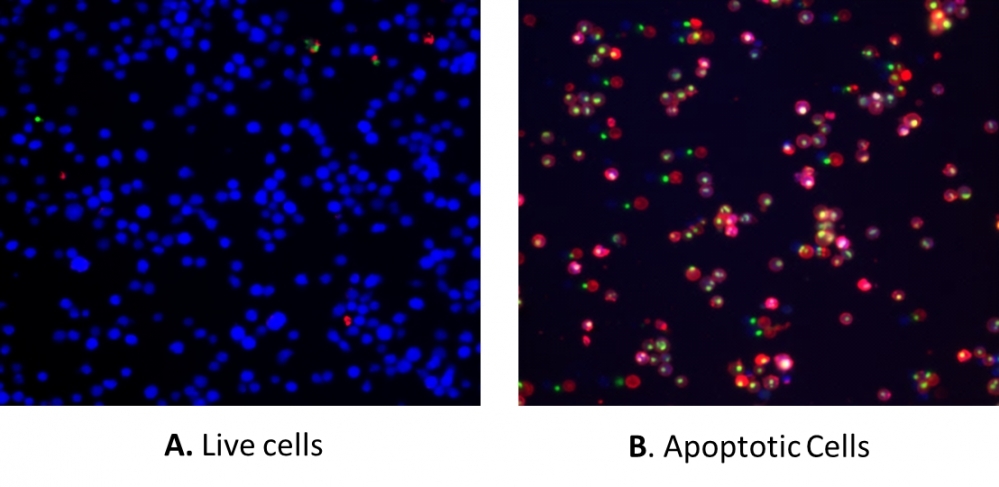
Our Cell Meter™ assay kits are a set of tools for monitoring cell viability. There are a variety of parameters that can be used. This particular kit is designed to simultaneously monitor apoptotic, necrotic, and healthy cells. Apoptosis is described as an active, programmed process of autonomous cellular dismantling that avoids eliciting inflammation. In apoptosis, phosphatidylserine (PS) is transferred to the outer leaflet of the plasma membrane. As a universal indicator of the initial/intermediate stages of cell apoptosis, the appearance of phosphatidylserine on the cell surface can be detected before morphological changes are observed. The PS sensor used in this kit has red fluorescence upon binding to membrane PS. Necrosis has been characterized as passive, accidental cell death resulting from environmental perturbations with the uncontrolled release of inflammatory cellular contents. Loss of plasma membrane integrity, as demonstrated by the ability of a membrane-impermeable DNA Nuclear Green™ DCS1 (Ex/Em = 490/525 nm) to label the nucleus, represents a straightforward approach to demonstrate late-stage apoptosis and necrosis. In addition, this kit also provides a live cell cytoplasm labeling dye, CytoCalcein™ Violet 450 (Ex/Em = 405/450 nm), for labeling living cell cytoplasm. This kit is optimized to simultaneously detect cell apoptosis (red and/or green), necrosis (green), and healthy cells (blue) with a flow cytometer or fluorescence microscope.

Example protocol

AT A GLANCE

Protocol summary

  1. Prepare cells with test compounds (200 µL/sample)
  2. Add Apopxin™ Deep Red assay solution
  3. Incubate at room temperature for 30 - 60 minutes
  4. Analyze cells with a flow cytometer with 660/20 nm (for apotosis-APC channel), 530/30 nm (for necrosis-FITC channel) and 450/40 nm emission filter (for healthy cells-Pacific Blue channel) or fluorescence microscope with DAPI (Healthy cells), FITC (Necrosis cells) and Cy5 filters (Apoptotic cells)

Important notes
Thaw all the kit components at room temperature before starting the experiment.

PREPARATION OF STOCK SOLUTION

Unless otherwise noted, all unused stock solutions should be divided into single-use aliquots and stored at -20 °C after preparation. Avoid repeated freeze-thaw cycles.

1. CytoCalcein™ Violet 450 stock solution (200X):
Add 100 µL of DMSO into the vial of CytoCalcein™ Violet 450 (Component D) to make 200X CytoCalcein™ Violet 450 stock solution. Protect from light.

For guidelines on cell sample preparation, please visit
https://www.aatbio.com/resources/guides/cell-sample-preparation.html

SAMPLE EXPERIMENTAL PROTOCOL

Prepare and incubate cells with Apopxin™ Deep Red:

  1. Treat cells with test compounds for a desired period of time (4-6 hours for Jurkat cells treated with staurosporine) to induce apoptosis.

  2. Centrifuge the cells to get 1-5×10⁵ cells/tube.

  3. Resuspend cells in 200 µL of Assay Buffer (Component B).

  4. Add 2 µL of 100X Apopxin™ Deep Red (Component A) into the cells. 

  5. Optional 1: Add 1 µL of 200X Nuclear Green™ DCS1 (Component C) into the cells for necrosis cells.

  6. Optional 2: Then add 1 µL of 200X CytoCalcein™ Violet 450 stock solution into the cells for healthy cells staining.

  7. Incubate at room temperature for 30 to 60 minutes, protected from light.

  8. Add 300 µL of Assay Buffer (Component B) to increase volume before analyzing the cells with a flow cytometer or fluorescence microscope.

  9. Monitor the fluorescence intensity using a flow cytometer with 660/20 nm (for apotosis-APC channel), 530/30 nm (for necrosis-FITC channel) and 450/40 nm emission filter (for healthy cells-Pacific Blue channel) or fluorescence microscope with DAPI (Healthy cells), FITC (Necrosis cells) and Cy5 filters (Apoptotic cells).

Analyze cells using a flow cytometer:

  1. Quantify Apopxin™ Deep Red binding using a flow cytometer with 660/20 nm (for apotosis-APC channel), 530/30 nm (for necrosis-FITC channel) and 450/40 nm emission filter (for healthy cells-Pacific Blue channel). Note: The flow cytometric analysis of Apopxin™ binding to adherent cells is not routinely tested since specific membrane damage may occur during cell detachment or harvesting. However, methods for utilizing Annexin V for flow cytometry on adherent cell types have been previously reported by Casiola-Rosen et al. and van Engelend et al.

 Analyze cells using a fluorescence microscope:

  1. Pipette the cell suspension after incubation, rinse 1-2 times with Assay Buffer, and then resuspend the cells with Assay Buffer.

  2. Add the cells on a glass slide that is covered with a glass cover-slip or a black wall/clear bottom 96-well microplate. Note: For adherent cells, it is recommended to grow the cells directly on a cover-slip (or a black wall/clear bottom 96-well microplate). After incubation with Apopxin™ Deep Red, rinse 1-2 times with assay buffer, and then add assay buffer back to the cover-slip (or a black wall/clear bottom 96-well microplate). Invert cover-slip on a glass slide and visualize the cells. The cells can also be fixed in 2% formaldehyde after the incubation with Apopxin™ Deep Red and visualized under a microscope.

  3. Analyze the apoptotic cells with Apopxin™ Deep Red under a fluorescence microscope using Cy5 filter. Measure the cell viability using FITC filter when Nuclear Green™ DCS1 is added, and/or Violet filter when CytoCalcein™ Violet 450 is added into the cells. The red staining on the plasma membrane indicates the Apopxin™ Deep Red binding to PS on cell surface.

Citations

View all 6 citations: Citation Explorer
Transcriptional coregulator Ess2 controls survival of post-thymic CD4+ T cells through the Myc and IL-7 signaling pathways
Authors: Takada, Ichiro and Hidano, Shinya and Takahashi, Sayuri and Yanaka, Kaori and Ogawa, Hidesato and Tsuchiya, Megumi and Yokoyama, Atsushi and Sato, Shingo and Ochi, Hiroki and Nakagawa, Tohru and others,
Journal: Journal of Biological Chemistry (2022)
Dasatinib can Impair Left Ventricular Mechanical Function But May Lack Proarrhythmic Effect: A Proposal of Non-clinical Guidance for Predicting Clinical Cardiovascular Adverse Events of Tyrosine Kinase Inhibitors
Authors: Izumi-Nakaseko, Hiroko and Fujiyoshi, Masachika and Hagiwara-Nagasawa, Mihoko and Goto, Ai and Chiba, Koki and Kambayashi, Ryuichi and Naito, Atsuhiko T and Ando, Kentaro and K, undefined and a, Yasunari and Ishii, Itsuko and others, undefined
Journal: Cardiovascular Toxicology (2019): 1--13
Anthocyanin-rich blackcurrant extract inhibits proliferation of the MCF10A healthy human breast epithelial cell line through induction of G0/G1 arrest and apoptosis
Authors: Nanashima, Naoki and Horie, Kayo and Chiba, Mitsuru and Nakano, Manabu and Maeda, Hayato and Nakamura, Toshiya
Journal: Molecular Medicine Reports (2017): 6134--6141
Clusterin signals via ApoER2/VLDLR and induces meiosis of male germ cells
Authors: Riaz, Muhammad Assad and Stammler, Angelika and Borgers, Mareike and Konrad, Lutz
Journal: American Journal of Translational Research (2017): 1266
Detecting Apoptosis, Autophagy, and Necrosis
Authors: Coleman, Jack and Liu, Rui and Wang, Kathy and Kumar, Arun
Journal: Apoptosis Methods in Toxicology (2016): 77--92

References

View all 71 references: Citation Explorer
PVP-coated silver nanoparticles and silver ions induce reactive oxygen species, apoptosis and necrosis in THP-1 monocytes
Authors: Foldbjerg R, Olesen P, Hougaard M, Dang DA, Hoffmann HJ, Autrup H.
Journal: Toxicol Lett (2009): 156
Concurrent induction of necrosis, apoptosis, and autophagy in ischemic preconditioned human livers formerly treated by chemotherapy
Authors: Domart MC, Esposti DD, Sebagh M, Olaya N, Harper F, Pierron G, Franc B, Tanabe KK, Debuire B, Azoulay D, Brenner C, Lemoine A.
Journal: J Hepatol (2009): 881
Rapid simultaneous determination of apoptosis, necrosis, and viability in sulfur mustard exposed HaCaT cell cultures
Authors: Heinrich A, Balszuweit F, Thiermann H, Kehe K.
Journal: Toxicol Lett (2009): 260
RAS mutations affect tumor necrosis factor-induced apoptosis in colon carcinoma cells via ERK-modulatory negative and positive feedback circuits along with non-ERK pathway effects
Authors: Kreeger PK, M and hana R, Alford SK, Haigis KM, Lauffenburger DA.
Journal: Cancer Res (2009): 8191
Susceptibility of the C2 canine mastocytoma cell line to the effects of tumor necrosis factor-related apoptosis-inducing ligand (TRAIL)
Authors: Elders RC, Baines SJ, Catchpole B.
Journal: Vet Immunol Immunopathol (2009): 11
Page updated on October 24, 2024

Ordering information

Price
Unit size
Catalog Number22843
Quantity
Add to cart

Additional ordering information

Telephone1-800-990-8053
Fax1-800-609-2943
Emailsales@aatbio.com
InternationalSee distributors
Bulk requestInquire
Custom sizeInquire
Technical SupportContact us
Purchase orderSend to sales@aatbio.com
ShippingStandard overnight for United States, inquire for international
Request quotation

Storage, safety and handling

H-phraseH303, H313, H333
Hazard symbolXN
Intended useResearch Use Only (RUO)
R-phraseR20, R21, R22
UNSPSC12352200

Platform

Flow cytometer

Excitation405 nm, 488 nm, 633 nm laser
Emission450, 40 nm, 530, 30 nm, 660, 20 nm filter
Instrument specification(s)Pacific Blue, FITC, APC channel

Fluorescence microscope

ExcitationDAPI, FITC, Cy5 filter sets
EmissionDAPI, FITC, Cy5 filter sets
Recommended plateBlack wall, clear bottom

Components

The detection of binding activity of Apopxin™ Deep Red to phosphatidylserine in Jurkat cells using Cell Meter™ Apoptotic and Necrotic Mulptiplexing Detection Kit II. The fluorescence images showing cells that are live (blue, stained by CytoCalcein™ Violet 450), apoptotic (red, stained by Apopxin™ Deep Red), and necrotic (green, indicated by Nuclear Green™ DCS1 staining) in Jurkat cells induced by 1 μM staurosporine for 3 hours. The fluorescence images of the cells were taken with Olympus fluorescence microscope through the Violet, Cy5 and FITC channel respectively. Individual images taken from each channel from the same cell population were merged as shown above. A: Non-induced control cells; B: Triple staining of staurosporine-induced cells.