Cell Meter™ Mitochondrion Membrane Potential Assay Kit *
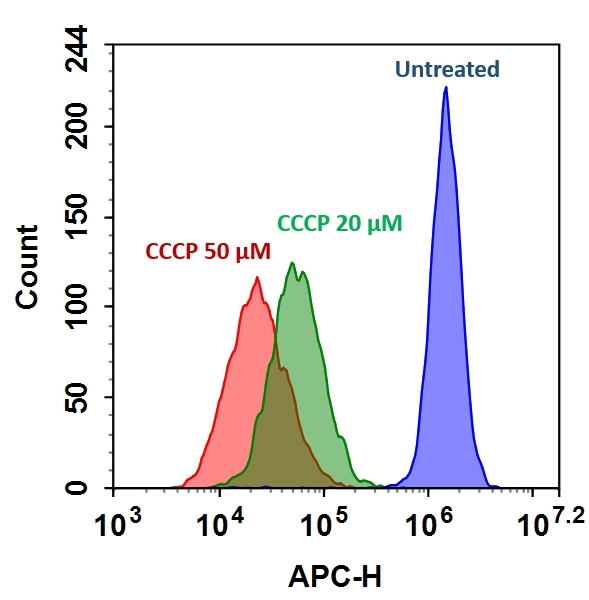
Red Fluorescence Optimized for Flow Cytometry*
Ordering information
Price | |
Catalog Number | |
Unit Size | |
Quantity |
Additional ordering information
Telephone | 1-800-990-8053 |
Fax | 1-800-609-2943 |
sales@aatbio.com | |
Quotation | Request |
International | See distributors |
Shipping | Standard overnight for United States, inquire for international |
Spectral properties
Excitation (nm) | 613 |
Emission (nm) | 631 |
Storage, safety and handling
H-phrase | H303, H313, H333 |
Hazard symbol | XN |
Intended use | Research Use Only (RUO) |
R-phrase | R20, R21, R22 |
UNSPSC | 12352200 |
Alternative formats
Related products
Overview | ![]() ![]() |
See also: Flow Cytometry Reagents
Excitation (nm) 613 | Emission (nm) 631 |
Our Cell Meter™ assay kits are a set of tools for monitoring cell viability. There are a variety of parameters that can be used. This particular kit is designed to detect cell apoptosis by measuring the loss of the mitochondrial membrane potential (MMP). The collapse of MMP coincides with the opening of the mitochondrial permeability transition pores, leading to the release of cytochrome C into the cytosol, which in turn triggers other downstream events in the apoptotic cascade. Our Cell Meter™ Mitochondrial Membrane Potential Assay Kit provides all the essential components with an optimized assay method. This fluorimetric assay uses our proprietary cationic MitoTell™ Red for the detection of apoptosis in cells with the loss of MMP. In normal cells, the red fluorescence intensity is increased when MitoTell™ Red is accumulated in the mitochondria. However, in apoptotic cells, the fluorescence intensity of MitoTell™ Red decreases following the collapse of MMP. Cells stained with MitoTell™ Red can be visualized with a flow cytometer at APC or Cy5 channel. The kit is optimized for screening apoptosis activators and inhibitors with a flow cytometer.
Platform
Flow cytometer
Excitation | 640 nm laser |
Emission | 660/20 nm filter |
Instrument specification(s) | APC channel |
Components
Example protocol
AT A GLANCE
Protocol summary
- Prepare cells with test compounds at the density of 5 × 10⁵ to 1 × 10⁶ cells/mL
- Add 1 µL of 500X MitoTell™ Red into 0.5 mL of cell solution
- Incubate the cells in a 37 °C, 5% CO2 incubator for 15 - 30 minutes
- Pellet the cells, and resuspend the cells in 0.5 mL of assay buffer
- Analyze cells using flow cytometer with APC or Cy5 channel
Important notes
Thaw all the kit components at room temperature before starting the experiment.
SAMPLE EXPERIMENTAL PROTOCOL
- For each sample, prepare cells in 0.5 mL of warm medium or buffer of your choice at the density of 5×10⁵ to 1×10⁶ cells/mL. Note: Each cell line should be evaluated on an individual basis to determine the optimal cell density for apoptosis induction.
- Treat cells with test compounds for a desired period of time to induce apoptosis, and set up parallel control experiments. Note: We treated Jurkat cells with 20µM CCCP for 15 min at 37ºC to change the mitochondrial membrane potential. See Figure 1 for details. CCCP or FCCP can be added simultaneously with MitoTell™ Red. To get the best result, titration of the CCCP or FCCP may be required for each individual cell line.
- Add 1 µL of 500X MitoTell™ Red (Component A) into the treated cells.
- Incubate the cells in a 37 °C, 5% CO2 incubator for 15 to 30 minutes. Note: For adherent cells, gently lift the cells with 0.5 mM EDTA to keep the cells intact and wash the cells once with serum-containing media prior to the incubation with MitoTell™ Red.
- Centrifuge the cells at 800 rpm for 4 minutes, and then re-suspend cells in 0.5 mL of Assay Buffer (Component B) or buffer of your choice.
- Monitor the fluorescence intensity using a flow cytometer wih APC or Cy5 channel. Gate on the cells of interest, excluding debris.
Images

Figure 1. The decrease in fluorescence intensity of MitoTell™ Red in response to CCCP treatment in Jurkat cells. Jurkat cells were loaded with MitoTell™ Red alone (Blue) or in the presence of 20 μM (Green) or 50 μM CCCP (Red) for 30 minutes. The fluorescence intensity of MitoTell™ Red was measured using ACEA NovoCyte flow cytometer at APC channel.
References
View all 91 references: Citation Explorer
Safranine O as a fluorescent probe for mitochondrial membrane potential studied on the single particle level and in suspension
Authors: Perevoshchikova IV, Sorochkina AI, Zorov DB, Antonenko YN.
Journal: Biochemistry (Mosc) (2009): 663
Authors: Perevoshchikova IV, Sorochkina AI, Zorov DB, Antonenko YN.
Journal: Biochemistry (Mosc) (2009): 663
Determination of high mitochondrial membrane potential in spermatozoa loaded with the mitochondrial probe 5,5',6,6'-tetrachloro-1,1',3,3'-tetraethylbenzimidazolyl-carbocyanine iodide (JC-1) by using fluorescence-activated flow cytometry
Authors: Guthrie HD, Welch GR.
Journal: Methods Mol Biol (2008): 89
Authors: Guthrie HD, Welch GR.
Journal: Methods Mol Biol (2008): 89
The mitochondrial membrane potential and Ca2+ oscillations in smooth muscle
Authors: Chalmers S, McCarron JG.
Journal: J Cell Sci (2008): 75
Authors: Chalmers S, McCarron JG.
Journal: J Cell Sci (2008): 75
Computer-assisted live cell analysis of mitochondrial membrane potential, morphology and calcium handling
Authors: Koopman WJ, Distelmaier F, Esseling JJ, Smeitink JA, Willems PH.
Journal: Methods (2008): 304
Authors: Koopman WJ, Distelmaier F, Esseling JJ, Smeitink JA, Willems PH.
Journal: Methods (2008): 304
How DASPMI reveals mitochondrial membrane potential: fluorescence decay kinetics and steady-state anisotropy in living cells
Authors: Ramadass R, Bereiter-Hahn J.
Journal: Biophys J (2008): 4068
Authors: Ramadass R, Bereiter-Hahn J.
Journal: Biophys J (2008): 4068
Life cell quantification of mitochondrial membrane potential at the single organelle level
Authors: Distelmaier F, Koopman WJ, Testa ER, de Jong AS, Swarts HG, Mayatepek E, Smeitink JA, Willems PH.
Journal: Cytometry A (2008): 129
Authors: Distelmaier F, Koopman WJ, Testa ER, de Jong AS, Swarts HG, Mayatepek E, Smeitink JA, Willems PH.
Journal: Cytometry A (2008): 129
Effects of eprosartan on mitochondrial membrane potential and H2O2 levels in leucocytes in hypertension
Authors: Labios M, Martinez M, Gabriel F, Guiral V, Ruiz-Aja S, Beltran B, Munoz A.
Journal: J Hum Hypertens (2008): 493
Authors: Labios M, Martinez M, Gabriel F, Guiral V, Ruiz-Aja S, Beltran B, Munoz A.
Journal: J Hum Hypertens (2008): 493
Mitochondrial membrane potential in axons increases with local nerve growth factor or semaphorin signaling
Authors: Verburg J, Hollenbeck PJ.
Journal: J Neurosci (2008): 8306
Authors: Verburg J, Hollenbeck PJ.
Journal: J Neurosci (2008): 8306
Evaluation of sperm mitochondrial membrane potential by JC-1 fluorescent staining and flow cytometry
Authors: Xia XY, Wu YM, Hou BS, Yang B, Pan LJ, Shi YC, Jin BF, Shao Y, Cui YX, Huang YF.
Journal: Zhonghua Nan Ke Xue (2008): 135
Authors: Xia XY, Wu YM, Hou BS, Yang B, Pan LJ, Shi YC, Jin BF, Shao Y, Cui YX, Huang YF.
Journal: Zhonghua Nan Ke Xue (2008): 135
Cyclosporin A-induced oxidative stress is not the consequence of an increase in mitochondrial membrane potential
Authors: van der Toorn M, Kauffman HF, van der Deen M, Slebos DJ, Koeter GH, Gans RO, Bakker SJ.
Journal: Febs J (2007): 3003
Authors: van der Toorn M, Kauffman HF, van der Deen M, Slebos DJ, Koeter GH, Gans RO, Bakker SJ.
Journal: Febs J (2007): 3003