Products
Services
Resources
Selection Guides
About
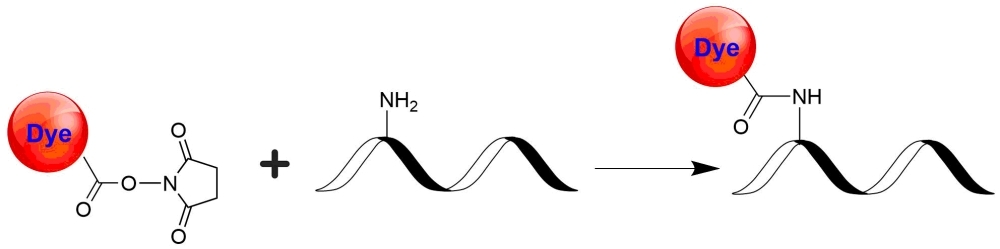
Cy3DIGE NHS ester
Cy3DIGE NHS ester, an equivalent of Cy3® NHS ester minimal dye, is one of the major colors used for labeling proteins subject to DIGE analysis. Cy3DIGE is commonly used together with C2DIGE and/or Cy5DIGE. Cy2DIGE, C3DIGE and Cy5DIGE are specially designed for precise comparison of protein expression in two or three samples of lysates. Perfect mobility matching and bright dye fluorescence allow the efficient detection and high resolution of minor proteins on 2D gel electrophoresis. Cy2DIGE, C3DIGE and Cy5DIGE are compatible to all imagers capable of detection of Cy2, Cy3, and Cy5 dyes. The gels labeled with Cy2DIGE, C3DIGE and Cy5DIGE are size- and charge-matched fluorescent dyes for detecting protein abundance differences in 2-D Fluorescence Difference Gel Electrophoresis (DIGE). Cy2DIGE, C3DIGE and Cy5DIGE detect up to three prelabeled protein samples and standards on the same 2-D electrophoresis gel. The size- and charge-matched dyes enable co-migration of labeled samples within the gel. They are bright on proteins, allowing the minimal loss of signal during labeling, separation, and scanning. These dyes have minimal spectral overlap, minimizing the crosstalk that commonly contributes to high background. Their pH-insensitive fluorescence allows DIGEs run at a broad pH range. Cy2®, Cy3® and Cy5® are the trademarks of GE Healthcare.
| Catalog | Size | Price | Quantity |
|---|---|---|---|
| 25303 | 100 nmoles | Price |

Physical properties
| Molecular weight | 709.67 |
| Solvent | DMSO |
Spectral properties
| Correction factor (260 nm) | 0.07 |
| Correction factor (280 nm) | 0.073 |
| Extinction coefficient (cm -1 M -1) | 150000 1 |
| Excitation (nm) | 555 |
| Emission (nm) | 569 |
| Quantum yield | 0.15 1 |
Usage and storage
| Intended use | Research Use Only (RUO) |
| Storage | Freeze (< -15 °C); Minimize light exposure |
Contact us
| Telephone | |
| Fax | |
| sales@aatbio.com | |
| International | See distributors |
| Bulk request | Inquire |
| Custom size | Inquire |
| Technical Support | Contact us |
| Request quotation | Request |
| Purchase order | Send to sales@aatbio.com |
| Shipping | Standard overnight for United States, inquire for international |
Page updated on July 17, 2026