logo
AAT Bioquest

Protonex™ Red 600, SE

The pH dependent Emission spectra of Protonex™ Red 600.
Ordering information
Price
Catalog Number
Unit Size
Quantity
Add to cart
Additional ordering information
Telephone1-800-990-8053
Fax1-800-609-2943
Emailsales@aatbio.com
QuotationRequest
InternationalSee distributors
ShippingStandard overnight for United States, inquire for international
Physical properties
Molecular weight953.06
SolventDMSO
Spectral properties
Excitation (nm)576
Emission (nm)597
Storage, safety and handling
H-phraseH303, H313, H333
Hazard symbolXN
Intended useResearch Use Only (RUO)
R-phraseR20, R21, R22
StorageFreeze (< -15 °C); Minimize light exposure
UNSPSC12352200

OverviewpdfSDSpdfProtocol


Molecular weight
953.06
Excitation (nm)
576
Emission (nm)
597
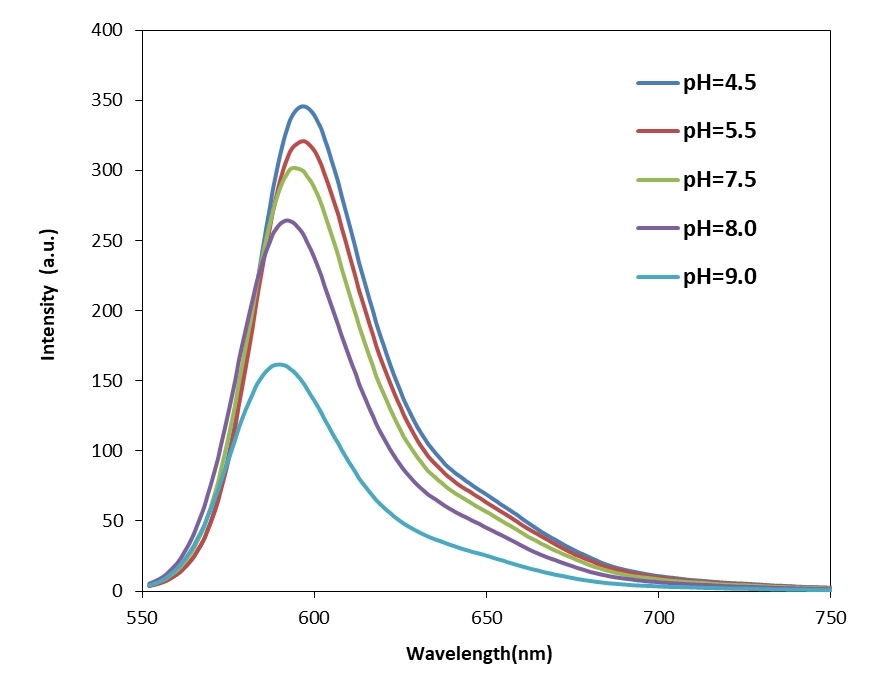
Protonex™ Red dye demonstrated pH-dependent fluorescence. Unlike most of the existing fluorescent dyes that are more fluorescent at higher pH, acidic conditions enhance the fluorescence of Protonex™ Red dye. The fluorescence of Protonex™ Red dye dramatically increases as pH decreases from neutral to the acidic. The weak fluorescence outside the cell may potentially eliminates the wash steps. Protonex™ Red dye provides a powerful tool to monitor acidic cell compartments such as endosomes and lysosomes. Protonex™ Red dye is weakly fluorescent outside the cells, but its fluorescence is significantly enhanced in acidic compartments (such as phagosomes, lysosomes and endosomes). This Protonex™ Red enables the specific detection of cellular acidic compartments with reduced signal variability and improved accuracy for imaging or flow applications. It can be also used for multiplexing cellular functional analysis with green dyes such as GFP, Fluo-8, calcein, or FITC-labeled antibodies. Protonex™ Red has the spectral properties similar to those of Texas Red, making the common filter set of Texas Red readily available to the assays of Protonex™ Red. This Protonex™ Red SE can be readily used to make a variety of bioconjugates for imaging or flow applications, enabling the specific detection of phagocytosis and endocytosis with reduced signal variability and improved accuracy. These conjugates can be also used for multiplexing cell functional analysis with green dyes such as GFP, Fluo-8, calcein, or FITC-labeled antibodies. Protonex™ Red has the spectral properties similar to those of Texas Red, making the common filter set of Texas Red readily available to the assays of Protonex™ Red.

Example protocol


PREPARATION OF STOCK SOLUTIONS

Unless otherwise noted, all unused stock solutions should be divided into single-use aliquots and stored at -20 °C after preparation. Avoid repeated freeze-thaw cycles.

1. Protein stock solution (Solution A)
Mix 100 µL of a reaction buffer (e.g., 1 M  sodium carbonate solution or 1 M phosphate buffer with pH ~9.0) with 900 µL of the target protein solution (e.g. antibody, protein concentration >2 mg/mL if possible) to give 1 mL protein labeling stock solution. Note: The pH of the protein solution (Solution A) should be 8.5 ± 0.5. If the pH of the protein solution is lower than 8.0, adjust the pH to the range of 8.0-9.0 using 1 M  sodium bicarbonate solution or 1 M pH 9.0 phosphate buffer. Note: The protein should be dissolved in 1X phosphate buffered saline (PBS), pH 7.2-7.4. If the protein is dissolved in Tris or glycine buffer, it must be dialyzed against 1X PBS, pH 7.2-7.4, to remove free amines or ammonium salts (such as ammonium sulfate and ammonium acetate) that are widely used for protein precipitation. Note: Impure antibodies or antibodies stabilized with bovine serum albumin (BSA) or gelatin will not be labeled well. The presence of sodium azide or thimerosal might also interfere with the conjugation reaction. Sodium azide or thimerosal can be removed by dialysis or spin column for optimal labeling results. Note: The conjugation efficiency is significantly reduced if the protein concentration is less than 2 mg/mL. For optimal labeling efficiency the final protein concentration range of 2-10 mg/mL is recommended.

2. Protonex™ Green 600, SE stock solution (Solution B)
Add anhydrous DMSO into the vial of Protonex™ Green 600, SE to make a 10 mM stock solution. Mix well by pipetting or vortex. Note: Prepare the dye stock solution (Solution B) before starting the conjugation. Use promptly. Extended storage of the dye stock solution may reduce the dye activity. Solution B can be stored in freezer for two weeks when kept from light and moisture. Avoid freeze-thaw cycles.

SAMPLE EXPERIMENTAL PROTOCOL

This labeling protocol was developed for the conjugate of Goat anti-mouse IgG with Protonex™ Green 600, SE. You might need further optimization for your particular proteins. Note: Each protein requires distinct dye/protein ratio, which also depends on the properties of dyes. Over labeling of a protein could detrimentally affects its binding affinity while the protein conjugates of low dye/protein ratio gives reduced sensitivity.

Run conjugation reaction
  1. Use 10:1 molar ratio of Solution B (dye)/Solution A (protein) as the starting point:  Add 5 µL of the dye stock solution (Solution B, assuming the dye stock solution is 10 mM) into the vial of the protein solution (95 µL of Solution A) with effective shaking. The concentration of the protein is ~0.05 mM assuming the protein concentration is 10 mg/mL and the molecular weight of the protein is ~200KD. Note: We recommend to use 10:1 molar ratio of Solution B (dye)/Solution A (protein). If it is too less or too high, determine the optimal dye/protein ratio at 5:1, 15:1 and 20:1 respectively.
  2. Continue to rotate or shake the reaction mixture at room temperature for 30-60 minutes. 

Purify the conjugation
The following protocol is an example of dye-protein conjugate purification by using a Sephadex G-25 column.
  1. Prepare Sephadex G-25 column according to the manufacture instruction.
  2. Load the reaction mixture (From "Run conjugation reaction") to the top of the Sephadex G-25 column.
  3. Add PBS (pH 7.2-7.4) as soon as the sample runs just below the top resin surface.
  4. Add more PBS (pH 7.2-7.4) to the desired sample to complete the column purification. Combine the fractions that contain the desired dye-protein conjugate. Note: For immediate use, the dye-protein conjugate need be diluted with staining buffer, and aliquoted for multiple uses. Note: For longer term storage, dye-protein conjugate solution need be concentrated or freeze dried. 

Calculators


Common stock solution preparation

Table 1. Volume of DMSO needed to reconstitute specific mass of Protonex™ Red 600, SE to given concentration. Note that volume is only for preparing stock solution. Refer to sample experimental protocol for appropriate experimental/physiological buffers.

0.1 mg0.5 mg1 mg5 mg10 mg
1 mM104.925 µL524.626 µL1.049 mL5.246 mL10.493 mL
5 mM20.985 µL104.925 µL209.85 µL1.049 mL2.099 mL
10 mM10.493 µL52.463 µL104.925 µL524.626 µL1.049 mL

Molarity calculator

Enter any two values (mass, volume, concentration) to calculate the third.

Mass (Calculate)Molecular weightVolume (Calculate)Concentration (Calculate)Moles
/=x=

Spectrum


Open in Advanced Spectrum Viewer
spectrum

Spectral properties

Excitation (nm)576
Emission (nm)597

Images


Citations


View all 2 citations: Citation Explorer
A novel anti-CD146 antibody specifically targets cancer cells by internalizing the molecule
Authors: Nollet, Marie and Stalin, Jimmy and Moyon, Anais and Traboulsi, Wael and Essaadi, Amel and Robert, St&eacute;phane and Malissen, Nausicaa and Bachelier, Richard and Daniel, Laurent and Foucault-Bertaud, Alex and rine , undefined and others, undefined
Journal: Oncotarget (2017): 112283
PHD2 is a regulator for glycolytic reprogramming in macrophages
Authors: Guentsch, Annemarie and Beneke, Angelika and Swain, Lija and Farhat, Katja and Nagarajan, Shunmugam and Wielockx, Ben and Raithatha, Kaamini and Dudek, Jan and Rehling, Peter and Zieseniss, Anke and others, undefined
Journal: Molecular and Cellular Biology (2016): MCB--00236

References


View all 56 references: Citation Explorer
Monitoring phospholipid dynamics during phagocytosis: application of genetically-encoded fluorescent probes
Authors: Sarantis H, Grinstein S.
Journal: Methods Cell Biol (2012): 429
Phagocytosis and digestion of pH-sensitive fluorescent dye (Eos-FP) transfected E. coli in whole blood assays from patients with severe sepsis and septic shock
Authors: Schreiner L, Huber-Lang M, Weiss ME, Hohmann H, Schmolz M, Schneider EM.
Journal: J Cell Commun Signal (2011): 135
The application of fluorescent probes for the analysis of lipid dynamics during phagocytosis
Authors: Flannagan RS, Grinstein S.
Journal: Methods Mol Biol (2010): 121
Quantification of microsized fluorescent particles phagocytosis to a better knowledge of toxicity mechanisms
Authors: Leclerc L, Boudard D, Pourchez J, Forest V, Sabido O, Bin V, Palle S, Grosseau P, Bernache D, Cottier M.
Journal: Inhal Toxicol (2010): 1091
Analysis of macrophage phagocytosis: quantitative assays of phagosome formation and maturation using high-throughput fluorescence microscopy
Authors: Steinberg BE, Grinstein S.
Journal: Methods Mol Biol (2009): 45
Phagocytosis and postphagocytic reaction of cord blood and adult blood monocyte after infection with green fluorescent protein-labeled Escherichia coli and group B Streptococci
Authors: Gille C, Leiber A, Mundle I, Spring B, Abele H, Spellerberg B, Hartmann H, Poets Ch F, Orlikowsky TW.
Journal: Cytometry B Clin Cytom (2009): 271
A fluorescently tagged C-terminal fragment of p47phox detects NADPH oxidase dynamics during phagocytosis
Authors: Li XJ, Tian W, Stull ND, Grinstein S, Atkinson S, Dinauer MC.
Journal: Mol Biol Cell (2009): 1520
Analysis of phosphoinositide dynamics during phagocytosis using genetically encoded fluorescent biosensors
Authors: Cosio G, Grinstein S.
Journal: Methods Mol Biol (2008): 287
Development of a highly specific rhodamine-based fluorescence probe for hypochlorous acid and its application to real-time imaging of phagocytosis
Authors: Kenmoku S, Urano Y, Kojima H, Nagano T.
Journal: J Am Chem Soc (2007): 7313
The nonopsonic allogeneic cell phagocytosis of macrophages detected by flow cytometry and two photon fluorescence microscope
Authors: Liu GW, Ma HX, Wu Y, Zhao Y.
Journal: Transpl Immunol (2006): 220