Bradford Protein Assay
Product key features
Amplite® Colorimetric Bradford Protein Quantitation Assay Kit provides a reliable colorimetric method for quantifying total protein concentration using Coomassie brilliant blue dye.
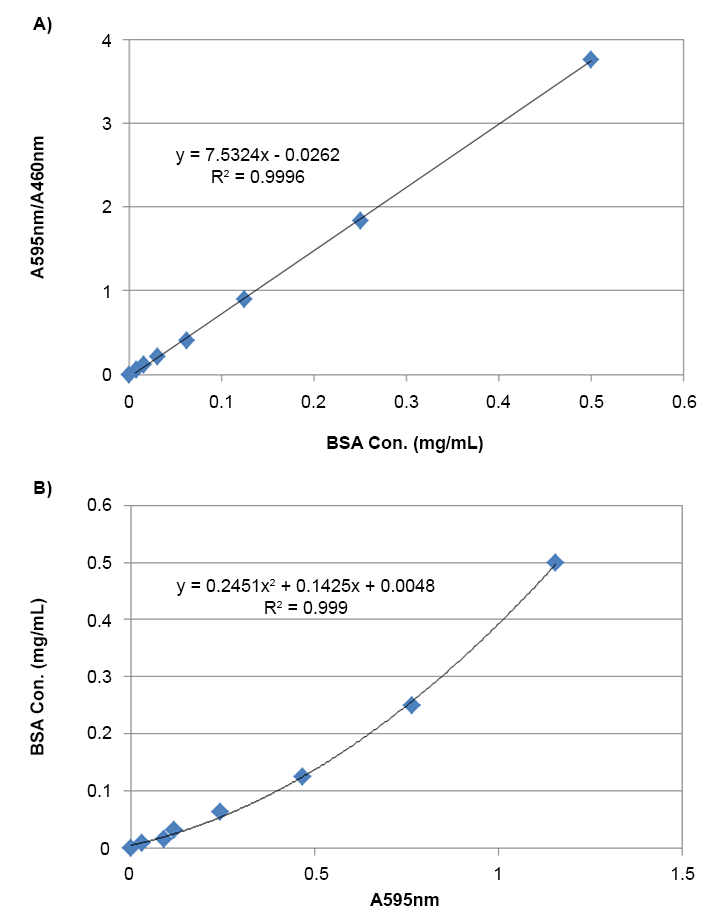
- Visible detection: Measures absorbance at 595 nm with a clear color shift from brown to blue
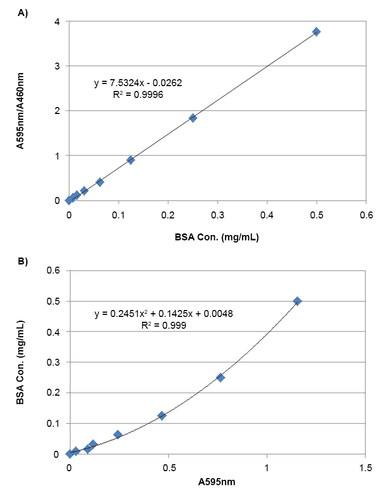
- Extended dynamic range: 595/460 nm ratio expands linear detection range up to 10-fold
- Applications: Ideal for quantifying total protein in biochemical and cell-based assays
- Comparable alternative: Serves as a reliable substitute for Bio-Rad’s Bradford Protein Assay Kit
Product description
The Amplite® Colorimetric Bradford Protein Quantitation Assay Kit is a colorimetric assay that quantifies protein concentration by measuring the absorbance shift of Coomassie Brilliant Blue G-250 dye from brown to blue. In acidic conditions, the dye exists in a reddish-brown cationic form (maximum absorbance at 470 nm). Upon binding to proteins, it forms strong, noncovalent complexes and shifts to a blue anionic form with a peak absorbance at 595 nm. The increase in absorbance at 595 nm is directly proportional to the protein concentration in solution.
Unlike UV-based 280 nm measurements that rely on aromatic amino acids, the Bradford method is based on interactions with basic amino acids such as arginine, lysine, and histidine. This allows for visible-spectrum detection and even visual inspection of protein content. While the traditional linear range is limited to ~10 µg/mL due to spectral overlap, using a dual-wavelength ratio (595/460 nm) significantly extends the assay's dynamic range, improving accuracy at higher protein concentrations.

Example protocol
AT A GLANCE
Prepare 1X Bradford working solution (90 μL)
Add BSA standards or test samples (10 μL)
- Incubate at room temperature for 5 - 15 minutes
Measure the absorbance at 595 nm and 460 nm, calculate the ratio of A595/A460 nm
Thaw all the kit components at room temperature before use.
PREPARATION OF STANDARD SOLUTIONS
https://www.aatbio.com/tools/serial-dilution/11118
PREPARATION OF WORKING SOLUTION
Prepare 1X Bradford working solution by diluting 1 part Bradford Assay Solution (Component A) to 4 parts of ddH2O.
SAMPLE EXPERIMENTAL PROTOCOL
Table 1. Layout of BSA standards and test samples in a clear bottom 96-well microplate. BS= BSA Standards (BS1 - BS7, 0.5 to 0.0078 mg/mL); BL=Blank Control; TS=Test Samples
BS7 | BS7 | TS | TS |
BS6 | BS6 | ... | ... |
BS5 | BS5 | ||
BS4 | BS4 | ||
BS3 | BS3 | ||
BS2 | BS2 | ||
BS1 | BS1 | ||
BL | BL |
Table 2. Reagent composition for each well
| Well | Volume | Reagent |
BS1-BS7 | 10 µL | Serial Dilutions (0.5 to 0.0078 mg/mL) |
| BL | 10 µL | PBS |
| TS | 10 µL | Test Samples |
Prepare BSA standards (BS), blank controls (BL), and test samples (TS) according to the layout provided in Tables 1 and 2.
Add 90 µL of 1X Bradford working solution to each well of BSA standard, blank control, and test samples to make the total assay volume of 100 µL/well.
- Incubate the reaction at room temperature for 5 to 15 minutes.
Measure the absorbance with an absorbance microplate reader at OD 595 nm and 460 nm, and calculate the ratio of A595/A460 nm.
Note: Please read 595 nm only if no 460 nm is available for the instrument.
Bradford assay calculator
Instructions
Given a set of absorbance and concentration values, this calculator will produce the best fit regression line to use as a standard curve. Please provide the concentration values for the known protein standards. Then provide either the 595 nm absorbance values, or both 595 nm and 460 nm absorbance values (if using ratiometric calculation method), in the fields below.Once data has been processed, select the column of absorbance values that corresponds with the protein standards. Clicking "calculate" will generate the standard curve. A table will be provided that indicates the concentrations of all protein samples, based on the absorbance values provided.
Alternative formats
References
Authors: Salisbury, Anne-Marie and Chen, Rui and Mullin, Marc and Foulkes, Lauren and Percival, Steven L
Journal: Surgical technology international (2020): 31-35
Authors: Lin, Qing and Li, Yan and Qu, Meng-Ke and Liu, Xing and Zhang, Zhi-Rong and Zhang, Ling
Journal: Sichuan da xue xue bao. Yi xue ban = Journal of Sichuan University. Medical science edition (2020): 81-86
Authors: Zhou, Tong-Tong and Wei, Cai-Hong and Lan, Wei-Qing and Zhao, Yong and Pan, Ying-Jie and Sun, Xiao-Hong and Wu, Vivian C H
Journal: Journal of food science (2020): 1513-1522
Authors: Larsen, Anna K and Hall, Arnaldur and Lundsgart, Henrik and Moghimi, S Moein
Journal: Methods in molecular biology (Clifton, N.J.) (2019): 301-311
Authors: Li, Chaohua and Sun, Yanan and Yang, Weifeng and Ma, Shuhua and Zhang, Lili and Zhao, Jing and Zhao, Xin and Wang, Yi
Journal: Evidence-based complementary and alternative medicine : eCAM (2019): 7276407