Products
Services
Resources
Selection Guides
About
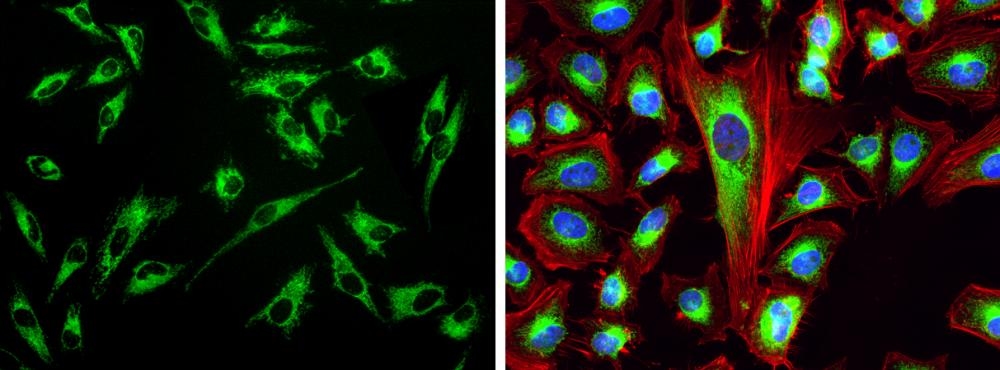
Cell Navigator® Mitochondrion Staining Kit
Green Fluorescence
Our Cell Navigator® fluorescence imaging kits are a set of fluorescence imaging tools for labeling sub-cellular organelles such as membranes, lysosomes, mitochondria and nuclei etc. The selective labeling of live cell compartments provides a powerful method for studying cellular events in a spatial and temporal context. This particular kit is designed to label mitochondria of live cells in green fluorescence. The kit uses a proprietary dye that selectively accumulates in mitochondria probably vial the mitochondrial membrane potential gradient. The mitochondrial indicator is a hydrophobic compound that easily permeates intact live cells, and trapped in mitochondria after it gets into cells. This fluorescent mitochondrial indicator is retained in mitochondria for long time since the indicator carries a cell-retaining group. This key feature significantly increases its staining efficiency. The labeling protocol is robust, requiring minimal hands-on time. It can be readily adapted for a wide variety of fluorescence platforms such as microplate assays, immunocytochemistry and flow cytometry. It is useful for a variety of studies, including cell adhesion, chemotaxis, multidrug resistance, cell viability, apoptosis and cytotoxicity. The kit provides all the essential components with an optimized cell-labeling protocol. It is suitable for proliferating and non-proliferating cells, and can be used for both suspension and adherent cells.
| Catalog | Size | Price | Quantity |
|---|---|---|---|
| 22666 | 500 Assays | Price |

Spectral properties
| Excitation (nm) | 508 |
| Emission (nm) | 528 |
Storage, safety and handling
| H-phrase | H303, H313, H333 |
| Hazard symbol | XN |
| Intended use | Research Use Only (RUO) |
| R-phrase | R20, R21, R22 |
| UNSPSC | 12352200 |
Instrument settings
| Fluorescence microscope | |
| Excitation | FITC filter set |
| Emission | FITC filter set |
| Recommended plate | Black wall/clear bottom |
Contact us
| Telephone | |
| Fax | |
| sales@aatbio.com | |
| International | See distributors |
| Bulk request | Inquire |
| Custom size | Inquire |
| Technical Support | Contact us |
| Request quotation | Request |
| Purchase order | Send to sales@aatbio.com |
| Shipping | Standard overnight for United States, inquire for international |
Page updated on June 21, 2026