logo
AAT Bioquest

CytoTrace™ Ultra Green

The comparison in the fluorescence intensity of CytoTrace&trade; Ultra Green with CMFDA in Jurkat cells. Jurkat cells were dye loaded with CytoTrace&trade; Ultra Green or CMFDA for 30 minutes in a 37 <sup>o</sup>C, 5% CO<sub>2</sub> incubator. The fluorescence intensity was measured using ACEA NovoCyte 3000 flow cytometer with FITC channel.
Ordering information
Price
Catalog Number
Unit Size
Quantity
Add to cart
Additional ordering information
Telephone1-800-990-8053
Fax1-800-609-2943
Emailsales@aatbio.com
InternationalSee distributors
Bulk requestInquire
Custom sizeInquire
ShippingStandard overnight for United States, inquire for international
Request quotation
Physical properties
Molecular weight822.72
SolventDMSO
Storage, safety and handling
H-phraseH303, H313, H333
Hazard symbolXN
Intended useResearch Use Only (RUO)
R-phraseR20, R21, R22
StorageFreeze (< -15 °C); Minimize light exposure
UNSPSC12352200

OverviewpdfSDSpdfProtocol


Molecular weight
822.72
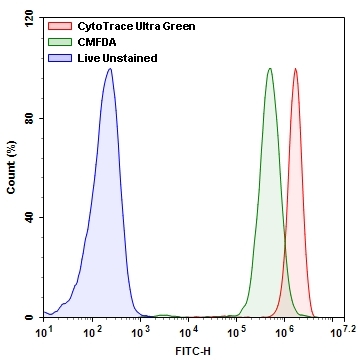
CMFDA (5-chloromethylfluorescein diacetate) has been used as a prominent cell tracker in the research community for a long time. We are introducing a new generation of fluorescent dye, named CytoTrace™ Ultra Green that is well suited for tracking the cell movement or location. The dye is well retained in cells, allowing tracking live cells for quite a few generations. Compared to CMFDA under the same conditions, CytoTrace™ Ultra Green is significantly brighter, more photostable and robust to use. Its fluorescence signal is also fixable. The signal generated by this dye is highly stable after fixation, making it ideal candidate to combine with other types of assays such as cytotoxicity etc for multicolor applications. The excitation and emission spectra of CytoTrace™ Ultra Green is identical to those of FITC, and are well separated from the common red fluorescent dyes such as Texas Red, Cy5, Cy7, iFluor® 647 & 750, Alexa Fluor® 647 and 750. CytoTrace™ Ultra Green can be readily used for tracking live cells for various biological applications, and compatible with flow cytometry and fluorescence microscopy.

Example protocol


AT A GLANCE

Protocol summary

  1. Prepare cells with test compounds
  2. Add 0.5 to 5 µM CytoTrace™ Ultra Green working solution
  3. Incubate dyes with cells at room temperature or 37 oC for 15 to 30 minutes
  4. Remove the dye working solution
  5. Analyze with a flow cytometer with Ex/Em = 490/520 nm-FITC filter set

PREPARATION OF STOCK SOLUTION

Unless otherwise noted, all unused stock solutions should be divided into single-use aliquots and stored at -20 °C after preparation. Avoid repeated freeze-thaw cycles.

CytoTrace™ Ultra Green stock solution (2-10 mM):
Add appropriate amount of DMSO and mix well to make CytoTrace™ Ultra Green stock solution (2-10 mM). Note: The stock solution should be used promptly; any remaining solution should be aliquoted and frozen at < -20 oC. Avoid repeated freeze-thaw cycles, and protect from light.

PREPARATION OF WORKING SOLUTION

CytoTrace™ Ultra Green working solution:
Prepare a 0.5 to 5 µM dye working solution right before use by diluting the DMSO stock solution from with Hanks and 20 mM Hepes buffer (HHBS) or the buffer of your choice, pH 7. Mix them well by vortexing. Note: In some cell types, lower concentration may be required to stain the cells. We recommend optimizing optimal concentration for each cell type before performing experiment.

SAMPLE EXPERIMENTAL PROTOCOL

  1. Treat cells with test compounds for a desired period of time.

  2. Centrifuge the cells to get 2-10 × 105 cells per tube.

  3. Resuspend cells in 500 µL of the CytoTrace™ Ultra Green working solution.

  4. Incubate cells with a dye solution at room temperature or 37 °C for 15 to 30 min, protected from light.

  5. Remove the dye working solution from the cells; Optional: The cells can be fixed with 4% formaldehyde.

  6. Wash the cells with HHBS or buffer of your choice once.

  7. Resuspend cells in 500 µL of pre-warmed HHBS or medium to get 2-10 × 105 cells per tube.

  8. Monitor the fluorescence change at Ex/Em = 490/520 nm with a flow cytometer or a fluorescence microscope with FITC filter set.
Product #IndicatorSizeMolecular WeightEx/Em (nm)Solvent
22014CytoTrace™ Orange CMTMR10x50 mg554.04541/565DMSO
22015CytoTrace™ Red CMPTX10x50 mg686.25577/602DMSO
22016CytoTrace™ Red CFDA1 mg652.43560/574DMSO
22017CytoTrace™ Green CMFDA1 mg464.86494/521DMSO
21800CytoTrace™ Ultra Green1 mg822.72494/521DMSO
22020FDA (Fluorescein diacetate)1 g416.83494/521DMSO

Calculators


Common stock solution preparation

Table 1. Volume of DMSO needed to reconstitute specific mass of CytoTrace™ Ultra Green to given concentration. Note that volume is only for preparing stock solution. Refer to sample experimental protocol for appropriate experimental/physiological buffers.

0.1 mg0.5 mg1 mg5 mg10 mg
1 mM121.548 µL607.74 µL1.215 mL6.077 mL12.155 mL
5 mM24.31 µL121.548 µL243.096 µL1.215 mL2.431 mL
10 mM12.155 µL60.774 µL121.548 µL607.74 µL1.215 mL

Molarity calculator

Enter any two values (mass, volume, concentration) to calculate the third.

Mass (Calculate)Molecular weightVolume (Calculate)Concentration (Calculate)Moles
/=x=

Product Family


NameExcitation (nm)Emission (nm)
CytoTrace™ Green CMFDA498517

Images


Citations


View all 5 citations: Citation Explorer
SPF-CellTracker: Tracking Multiple Cells with Strongly-Correlated Moves Using a Spatial Particle Filter
Authors: Hirose, O., Kawaguchi, S., Tokunaga, T., Toyoshima, Y., Teramoto, T., Kuge, S., Ishihara, T., Iino, Y., Yoshida, R.
Journal: IEEE/ACM Trans Comput Biol Bioinform (2018): 1822-1831
Challenges in using CellTracker Green on foraminifers that host algal endosymbionts
Authors: Ross, B. J., Hallock, P.
Journal: PeerJ (2018): e5304
CellTracker (not only) for dummies
Authors: Piccinini, F., Kiss, A., Horvath, P.
Journal: Bioinformatics (2016): 955-7
In vitro evaluation of the effects of cysticidal drugs in the Taenia crassiceps cysticerci ORF strain using the fluorescent CellTracker CMFDA
Authors: Trejo-Chavez, H., Garcia-Vilchis, D., Reynoso-Ducoing, O., Ambrosio, J. R.
Journal: Exp Parasitol (2011): 294-9
Survival of benthic foraminifera under hypoxic conditions: results of an experimental study using the CellTracker Green method
Authors: Pucci, F., Geslin, E., Barras, C., Morigi, C., Sabbatini, A., Negri, A., Jorissen, F. J.
Journal: Mar Pollut Bull (2009): 336-51

References


View all 23 references: Citation Explorer
Fluorescence-Based Transport Assays Revisited in a Human Renal Proximal Tubule Cell Line
Authors: Caetano-Pinto P, Janssen MJ, Gijzen L, Verscheijden L, Wilmer MJ, Masereeuw R.
Journal: Mol Pharm (2016): 933
The variable chemotherapeutic response of Malabaricone-A in leukemic and solid tumor cell lines depends on the degree of redox imbalance
Authors: Manna A, De Sarkar S, De S, Bauri AK, Chattopadhyay S, Chatterjee M.
Journal: Phytomedicine (2015): 713
Cell membrane tracker based on restriction of intramolecular rotation
Authors: Zhang C, Jin S, Yang K, Xue X, Li Z, Jiang Y, Chen WQ, Dai L, Zou G, Liang XJ.
Journal: ACS Appl Mater Interfaces (2014): 8971
Evaluation of stability and sensitivity of cell fluorescent labels when used for cell migration
Authors: Beem E, Segal MS.
Journal: J Fluoresc (2013): 975
A multiple model probability hypothesis density tracker for time-lapse cell microscopy sequences
Authors: Rezatofighi SH, Gould S, Vo BN, Mele K, Hughes WE, Hartley R.
Journal: Inf Process Med Imaging (2013): 110
TLM-Tracker: software for cell segmentation, tracking and lineage analysis in time-lapse microscopy movies
Authors: Klein J, Leupold S, Biegler I, Biedendieck R, Munch R, Jahn D.
Journal: Bioinformatics (2012): 2276
The interplay between Leishmania promastigotes and human Natural Killer cells in vitro leads to direct lysis of Leishmania by NK cells and modulation of NK cell activity by Leishmania promastigotes
Authors: Lieke T, Nylen S, Eidsmo L, Schmetz C, Berg L, Akuffo H.
Journal: Parasitology (2011): 1898
The exocytosis of fluorescent nanodiamond and its use as a long-term cell tracker
Authors: Fang CY, Vaijayanthimala V, Cheng CA, Yeh SH, Chang CF, Li CL, Chang HC.
Journal: Small (2011): 3363
Horizontal DNA transfer from donor to host cells as an alternative mechanism of epithelial chimerism after allogeneic hematopoietic cell transplantation
Authors: Waterhouse M, Themeli M, Bertz H, Zoumbos N, Finke J, Spyridonidis A.
Journal: Biol Blood Marrow Transplant (2011): 319
Overlap-Based Cell Tracker
Authors: Chalfoun J, Cardone A, Dima AA, Allen DP, Halter MW.
Journal: J Res Natl Inst Stand Technol (2010): 477