logo
AAT Bioquest

mFluor™ Blue 620 SE

Alternative formats
Related products
mFluor™ Violet 450 SE
mFluor™ Violet 510 SE
mFluor™ Violet 540 SE
mFluor™ Yellow 630 SE
mFluor™ Red 700 SE
mFluor™ Red 780 SE
mFluor™ Red 780 amine
mFluor™ Violet 450-VAD-FMK
mFluor™ 510-VAD-FMK
mFluor™ Violet 450-streptavidin conjugate
mFluor™ Violet 510-streptavidin conjugate
mFluor™ Violet 540-streptavidin conjugate
mFluor™ Blue 570-streptavidin conjugate
mFluor™ Green 620-streptavidin conjugate
mFluor™ Yellow 630-streptavidin conjugate
mFluor™ Red 700-streptavidin conjugate
mFluor™ Red 780-streptavidin conjugate
mFluor™ Violet 450-dUTP *1 mM in TE Buffer (pH 7.5)*
mFluor™ Violet 450 acid
mFluor™ Violet 510 acid
mFluor™ Violet 540 acid
mFluor™ Blue 570 acid
mFluor™ Green 620 acid
mFluor™ Yellow 630 acid
mFluor™ Red 700 acid
mFluor™ Violet 500 SE
mFluor™ UV375 SE
mFluor™ Red 780 acid
mFluor™ UV460 SE
mFluor™ Violet 610 SE
mFluor™ Green 630 SE
mFluor™ Red 780 Maleimide
mFluor™ Violet 550 SE
mFluor™ Violet 505 SE
mFluor™ Violet 590 SE
mFluor™ Violet 545 SE
mFluor™ UV420 SE
mFluor™ UV455 SE
mFluor™ UV520 SE
mFluor™ UV540 SE
mFluor™ UV610 SE
mFluor™ Violet 450 Azide
mFluor™ Violet 450 maleimide
mFluor™ UV 375 Biotin Conjugate
mFluor™ UV 460 Biotin Conjugate
mFluor™ Violet 500 Biotin Conjugate
mFluor™ Violet 540 Biotin Conjugate
mFluor™ Red 780 Biotin Conjugate
mFluor™ Violet 530 SE
mFluor™ Violet 530 maleimide
mFluor™ Violet 480 SE
mFluor™ Blue 660 tyramide
mFluor™ Violet 450-PEG4-Biotin Conjugate
mFluor™ Violet 450-Wheat Germ Agglutinin (WGA) Conjugate
mFluor™ Violet 500-Wheat Germ Agglutinin (WGA) Conjugate
mFluor™ Violet 540-Wheat Germ Agglutinin (WGA) Conjugate
mFluor™ Blue 580 Styramide
mFluor™ Blue 630 Styramide
mFluor™ Blue 660 Styramide
mFluor™ Green 620 Styramide
mFluor™ Red 780 Styramide
mFluor™ Violet 540 Styramide
mFluor™ Violet 545 Styramide
mFluor™ Violet 610 Styramide
mFluor™ UV455-streptavidin conjugate
mFluor™ Violet 545-streptavidin conjugate
mFluor™ Violet 550-streptavidin conjugate
mFluor™ Violet 590-streptavidin conjugate
mFluor™ Violet 610-streptavidin conjugate
mFluor™ UV 375 goat anti-mouse IgG (H+L)
mFluor™ UV 375 goat anti-rabbit IgG (H+L)
mFluor™ UV 375 goat anti-rabbit IgG (H+L) *Cross-Absorbed*
mFluor™ UV 375 goat anti-mouse IgG (H+L) *Cross-Absorbed*
mFluor™ Violet 510 goat anti-mouse IgG (H+L)
mFluor™ Violet 510 goat anti-mouse IgG (H+L) *Cross-Absorbed*
mFluor™ Violet 510 goat anti-rabbit IgG (H+L)
mFluor™ Violet 510 goat anti-rabbit IgG (H+L) *Cross-Absorbed*
mFluor™ Red 780 goat anti-rabbit IgG (H+L) *Cross-Absorbed*
mFluor™ Red 780 goat anti-rabbit IgG (H+L)
mFluor™ Red 780 goat anti-mouse IgG (H+L) *Cross-Absorbed*
mFluor™ Red 780 goat anti-mouse IgG (H+L)
mFluor™ Blue 585 Anti-human CD4 Antibody *SK3*
mFluor™ UV420-streptavidin conjugate
mFluor™ Green 615 SE
mFluor™ UV420 maleimide
mFluor™ UV540 maleimide
mFluor™ UV610 maleimide
mFluor™ Violet 610 maleimide
Show More (78)
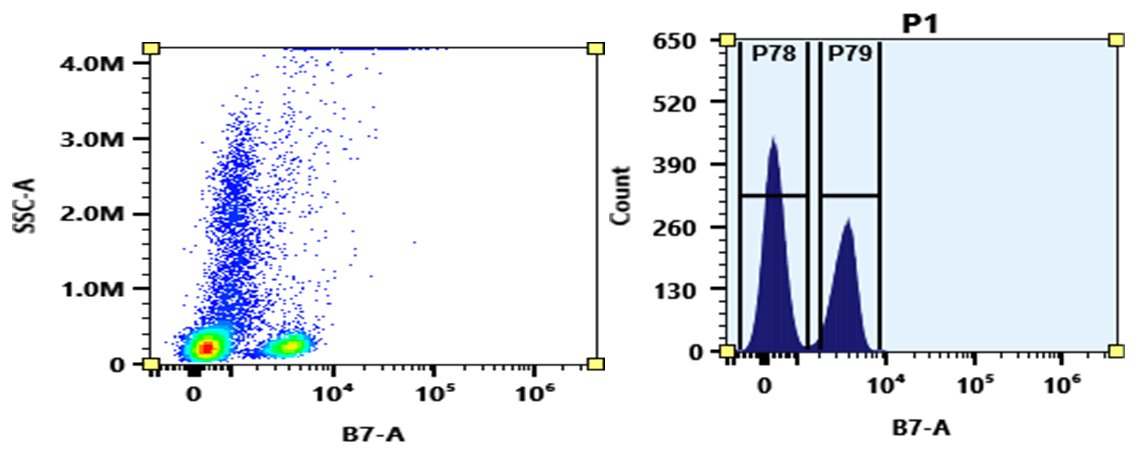
mFluor™ Blue 620 dye can be well excited with blue laser at 488 nm. It has a huge Stokes shift with emission ~620 nm. mFluor™ Blue 620 dyes are water-soluble, and the protein conjugates prepared with mFluor™ Blue 620 dyes are well excited at 488 nm to give red fluorescence. mFluor™ Blue 620 dye and conjugates are excellent blue laser reagents for flow cytometry detections. Compared to RPE, mFluor™ Blue 620 dyes are much more photostable, making them readily available for fluorescence imaging applications while it is very difficult to use RPE conjugates for fluorescence imaging applications due to the rapid photobleaching of RPE conjugates. It is also a unique fluorochrome for spectral flow cytometry since there are very few existing dyes that have this spectral profile.
Flow cytometry analysis of whole blood stained with mFluor™ Blue 620 anti-human CD4 *SK3* conjugate. The fluorescence signal was monitored using an Aurora spectral flow cytometer in the mFluor™ Blue 620 specific B7-A channel.
Fluorescent dye NHS esters (or succinimidyl esters) are the most popular tool for conjugating dyes to a peptide, protein, antibody, amino-modified oligonucleotide, or nucleic acid. NHS esters react readily with the primary amines (R-NH<sub>2</sub>) of proteins, amine-modified oligonucleotides, and other amine-containing molecules. The resulting dye conjugates are quite stable.
Ordering information
Price
Unit size
Catalog Number1163
Quantity
Add to cart
Additional ordering information
Telephone1-800-990-8053
Fax1-800-609-2943
Emailsales@aatbio.com
InternationalSee distributors
Bulk requestInquire
Custom sizeInquire
ShippingStandard overnight for United States, inquire for international
Request quotation
Physical properties
Molecular weight1743.06
SolventDMSO
Spectral properties
Absorbance (nm)591
Correction Factor (260 nm)0.683
Correction Factor (280 nm)0.849
Extinction coefficient (cm -1 M -1)980001
Excitation (nm)589
Emission (nm)616
Quantum yield0.181
Storage, safety and handling
H-phraseH303, H313, H333
Hazard symbolXN
Intended useResearch Use Only (RUO)
R-phraseR20, R21, R22
StorageFreeze (< -15 °C); Minimize light exposure
UNSPSC12171501
Example protocol

PREPARATION OF STOCK SOLUTIONS

Unless otherwise noted, all unused stock solutions should be divided into single-use aliquots and stored at -20 °C after preparation. Avoid repeated freeze-thaw cycles

Protein stock solution (Solution A)
  1. Mix 100 µL of a reaction buffer (e.g., 1 M  sodium carbonate solution or 1 M phosphate buffer with pH ~9.0) with 900 µL of the target protein solution (e.g., antibody, protein concentration >2 mg/mL if possible) to give 1 mL protein labeling stock solution.

    Note: The pH of the protein solution (Solution A) should be 8.5 ± 0.5. If it is lower than 8.0, adjust it to 8.0-9.0 using 1 M  sodium bicarbonate solution or 1 M pH 9.0 phosphate buffer.

    Note: The protein should be dissolved in 1X phosphate-buffered saline (PBS), pH 7.2-7.4. If the protein is dissolved in Tris or glycine buffer, it must be dialyzed against 1X PBS, pH 7.2-7.4, to remove free amines or ammonium salts (such as ammonium sulfate and ammonium acetate) that are widely used for protein precipitation.

    Note: Impure antibodies or antibodies stabilized with bovine serum albumin (BSA) or gelatin will not be labeled well. The presence of sodium azide or thimerosal might also interfere with the conjugation reaction. For optimal labeling results, sodium azide or thimerosal can be removed by dialysis or spin column.

    Note: The conjugation efficiency is significantly reduced if the protein concentration is less than 2 mg/mL. For optimal labeling efficiency, the final protein concentration range of 2-10 mg/mL is recommended.

mFluor™ Blue 620 SE stock solution (Solution B)
  1. Add anhydrous DMSO into the vial of mFluor™ Blue 620 SE to make a 10 mM stock solution. Mix well by pipetting or vortex.

    Note: Prepare the dye stock solution (Solution B) before starting the conjugation. Use promptly. Extended storage of the dye stock solution may reduce the dye activity. Solution B can be stored in a freezer for two weeks when kept from light and moisture. Avoid freeze-thaw cycles.

SAMPLE EXPERIMENTAL PROTOCOL

This labeling protocol was developed for the conjugate of Goat anti-mouse IgG with mFluor™ Blue 620 SE. You might need further optimization for your particular proteins.

Each protein requires a distinct dye/protein ratio, which also depends on the properties of the dyes. Over-labeling of a protein could detrimentally affect its binding affinity while the protein conjugates of low dye/protein ratio give reduced sensitivity.

Run conjugation reaction
  1. Use a 10:1 molar ratio of Solution B (dye)/Solution A (protein) as the starting point:  Add 5 µL of the dye stock solution (Solution B, assuming the dye stock solution is 10 mM) into the vial of the protein solution (95 µL of Solution A) with effective shaking. The concentration of the protein is ~0.05 mM, assuming the protein concentration is 10 mg/mL and the molecular weight of the protein is ~200KD.

    Note: We recommend using a 10:1 molar ratio of Solution B (dye)/Solution A (protein). If it is too low or too high, determine the optimal dye/protein ratio at 5:1, 15:1, and 20:1, respectively.

  2. Continue to rotate or shake the reaction mixture at room temperature for 30-60 minutes.
Purify the conjugation

The following protocol is an example of dye-protein conjugate purification by using a Sephadex G-25 column.

  1. Prepare Sephadex G-25 column according to the manufacture instruction.
  2. Load the reaction mixture (From "Run conjugation reaction") to the top of the Sephadex G-25 column.
  3. Add PBS (pH 7.2-7.4) as soon as the sample runs just below the top resin surface.
  4. Add more PBS (pH 7.2-7.4) to the desired sample to complete the column purification. Combine the fractions that contain the desired dye-protein conjugate.

    Note: For immediate use, dilute the dye-protein conjugate with staining buffer and aliquot for multiple uses.

    Note: For longer-term storage, the dye-protein conjugate solution must be concentrated or freeze-dried.

Characterize the Desired Dye-Protein Conjugate

The Degree of Substitution (DOS) is the most important factor for characterizing dye-labeled proteins. Proteins with lower DOS usually have weaker fluorescence intensity, but proteins with higher DOS tend to have reduced fluorescence, too. The optimal DOS for most antibodies is between 2 and 10, depending on the properties of the dye and protein. The following steps are used to determine the DOS of mFluor™ Blue 620 SE labeled proteins.

Measure Absorption

To measure the absorption spectrum of a dye-protein conjugate, it is recommended to keep the sample concentration in the range of 1-10 µM depending on the extinction coefficient of the dye.

Read OD (absorbance) at 280 nm and dye maximum absorption (ƛmax = 616 nm for mFluor™ Blue 620 dyes)

For most spectrophotometers, the sample (from the column fractions) need be diluted with de-ionized water so that the OD values are in the range of 0.1 to 0.9. The O.D. (absorbance) at 280 nm is the maximum absorption of protein while 616 nm is the maximum absorption of mFluor™ Blue 620 SE. To obtain accurate DOS, make sure that the conjugate is free of the non-conjugated dye.

Calculate DOS

You can calculate DOS using our tool by following this link:

https://www.aatbio.com/tools/degree-of-labeling-calculator  

Spectrum
Product family
NameExcitation (nm)Emission (nm)Extinction coefficient (cm -1 M -1)Correction Factor (260 nm)Correction Factor (280 nm)
mFluor™ Green 620 SE5256235000010.8950.569
References
View all 21 references: Citation Explorer
A Comprehensive Workflow for Applying Single-Cell Clustering and Pseudotime Analysis to Flow Cytometry Data.
Authors: Melsen, Janine E and van Ostaijen-Ten Dam, Monique M and Lankester, Arjan C and Schilham, Marco W and van den Akker, Erik B
Journal: Journal of immunology (Baltimore, Md. : 1950) (2020)
High-Dimensional Data Analysis Algorithms Yield Comparable Results for Mass Cytometry and Spectral Flow Cytometry Data.
Authors: Ferrer-Font, Laura and Mayer, Johannes U and Old, Samuel and Hermans, Ian F and Irish, Jonathan and Price, Kylie M
Journal: Cytometry. Part A : the journal of the International Society for Analytical Cytology (2020)
HTLV infected individuals have increased B-cell activation and proinflammatory regulatory T-cells.
Authors: Kjerulff, Bertram and Petersen, Mikkel Steen and Rodrigues, Candida Medina and da Silva Té, David and Christiansen, Mette and Erikstrup, Christian and Hønge, Bo Langhoff
Journal: Immunobiology (2020): 151878
Multispectral Flow Cytometry: Unaddressed Issues and Recommendations for Improvement.
Authors: Parks, David R
Journal: Cytometry. Part A : the journal of the International Society for Analytical Cytology (2020)
High-dimensional analysis of intestinal immune cells during helminth infection.
Authors: Ferrer-Font, Laura and Mehta, Palak and Harmos, Phoebe and Schmidt, Alfonso J and Chappell, Sally and Price, Kylie M and Hermans, Ian F and Ronchese, Franca and le Gros, Graham and Mayer, Johannes U
Journal: eLife (2020)