How to quantitate ATP induced calcium flux inside mammalian cells using fluorescent calcium indicators
Introduction

ATP induced calcium flux
To monitor the changes of cytoplasmic Ca2+ upon ATP stimulation, one can utilize fluorescent Ca2+ indicators by fluorescent microscopy, flow cytometry and fluorescent microplate reader etc. Fluorescent Ca2+ indicators provide convenient and sensitive measurement of Ca2+ inside cells. The first reliable measurement of Ca2+ was performed by Ridgway and Ashley by injecting the photoprotein aequorin into the giant muscle fiber of the barnacle. In the 1980s, Tsien and colleagues produced a variety of fluorescent indicators. Most of these fluorescent indicators are derivatives of BAPTA chelators that incorporate a photo induced electron transfer (PET) system responsive to Ca2+. Commonly used Ca2+ indicators can be found here. Here we provide a toolkit and one example to help you set up experiments for measuring Ca2+ changes inside cells upon ATP stimulation.
The Ca2+ quantitation toolkit
- Mammalian cells: P2 receptors are expressed in most cells, therefore any mammalian cell line or primary cells with intact P2 receptors should be adequate. However, not all cells respond to ATP equally, an ATP dose response is recommended to determine the best ATP concentrations. Cells should be maintained in appropriate cell culture medium and should be healthy prior to experiment.
- A cell permeant fluorescent Ca2+ indicator: Ca2+ indicators can be categorized by their spectral properties, measurement mode, dissociation constant (Kd) and cell permeability. You can learn how to pick a suitable Ca2+ indicator for our specific application here
For example, the most commonly used indicators are single wavelength at 488 nm excitation with suitable Kd based on intracellular Ca2+ concentrations. An indicator in cell-permeant acetoxymethyl (AM) ester form is also preferred as the indicator can passively diffused into the cells, where it can be retained by being cleaved into cell-impermeant product.
- A suitable assay buffer system: A physiological buffer with pH 7.4 is appropriate for this application. For example, Hanks' Balanced Salt Solution Buffer with 20 mM Hepes (HHBS) can be used. A physiological buffer that contains nonionic detergent Pluronic®F-127 is sometimes used to increase the aqueous solubility of Ca2+ If a buffer that also contains quencher, then wash step after dye loading can be avoided.
- An organic anion transporter inhibitor (optional): In certain cell types, e.g. CHO-K1 cells, once the AM form of the Ca2+ indicators are cleaved into a penta-anion by esterases, they can be extruded from the cells by anion transporters in the plasma membrane. The leakage of the dye can be inhibited by blocking the anion transporter with its inhibitors, e.g. probenecid (1-2 mM). However, probenecid can be toxic to cells.
- Measurement instruments: Since the Ca2+ signal is transient upon ATP stimulation, an instrument with programmable liquid handling for ATP injection and the capability of kinetic read with updates around every 1 second is ideal. For example, FLIPR system and FlexStation system from Molecular Devices are ideal for monitoring Ca2+ response in 96-, 384- and 1536-well microplates. Flow cytometry and fluorescent microscope with kinetic read ability are also proven to be useful in this application.
Utilizing Calbryte-520 AM Ca2+ indicator to study Ca2+ signal changes
Here we listed an example of utilizing Calbryte-520 AM Ca2+ indicator to study Ca2+ signal changes in CHO-K1 cells upon ATP stimulation by FlexStation, Fluorescent Microscope and Flow Cytometry.
CHO-K1 is ovary cells from Chinese hamster and it can be obtained from ATCC (Cat# CCL-61). CHO-K1 cells are used intensively in studies of cellular Ca2+ signaling. They are also one of the most commonly used cell lines for GPCR transgenic cell line generation. CHO-K1 responds to ATP stimulation well with EC50 around 1 µM.
Calbryte™-520 AM is a Ca2+ indicator with convenient excitation and emission wavelength at 492 nm and 514 nm, respectively. The Kd value of Calbryte™-520 is 1.2 µM, which makes it appropriate for measurement of intracellular Ca2+ changes. Calbryte™-520 is exceptionally bright upon binding to Ca2+ with very high signal to noise ratio when compared to other existing calcium indicators (such as Fluo-3 AM, Fluo-4 AM and Rhod-2 AM). Calbryte™-520 AM also have improved intracellular retention and loading efficiency. Calbryte™-520 AM does not require probenecid for retention inside CHO-K1 cells, therefore making dye loading more convenient and less cell toxic. Other Ca2+ indicators with different excitation and emission wavelength can also be considered for this application, please check here if interested. The Spectrum of various Ca2+ indicators can be compared using a Spectrum Viewer.
- CHO-K1 cells are plated the night before the experiment in growth medium at 40,000 to 80,000 cells/well/100 µL in a 96- well black wall/clear bottom cell culture plate.
- Calbryte™-520 AM should be reconstituted just before use in anhydrous DMSO and stored at -20°C in the dark. Calbryte™-520 AM is diluted to 10 µg/mL in HHBS with 0.04% Pluronic® F-127.
- Do not remove cell medium, add 100 µL of diluted Calbryte™-520 AM from the above step into the cells and incubate the plate at 37°C for 30 minutes to 1hr. The concentration of Calbryte™-520 AM is 5 µg/mL and Pluronic® F-127 is 0.02% in the 200 µL solution.
- ATP solution can be prepared when the cells are incubated. If a study of ATP dose dependent Ca2+ response is desired, ATP can be diluted into the HHBS at final concentration of 10, 3, 1, 0.3, 0.1, 0.03, 0.01 0 µM. If 50 µL of ATP is added into the assay following Calbryte™-520 AM incubation, then ATP should be prepared at 5X of final concentration. A Serial Dilution Calculator can assistant you with calculation.
- Remove the solution from each well, and add 200 µL of HHBS (with probenecid, if probenecid is used in step 2). If quenchers are used in the buffer from step 2, this step can be avoided.
- Run the assay using:
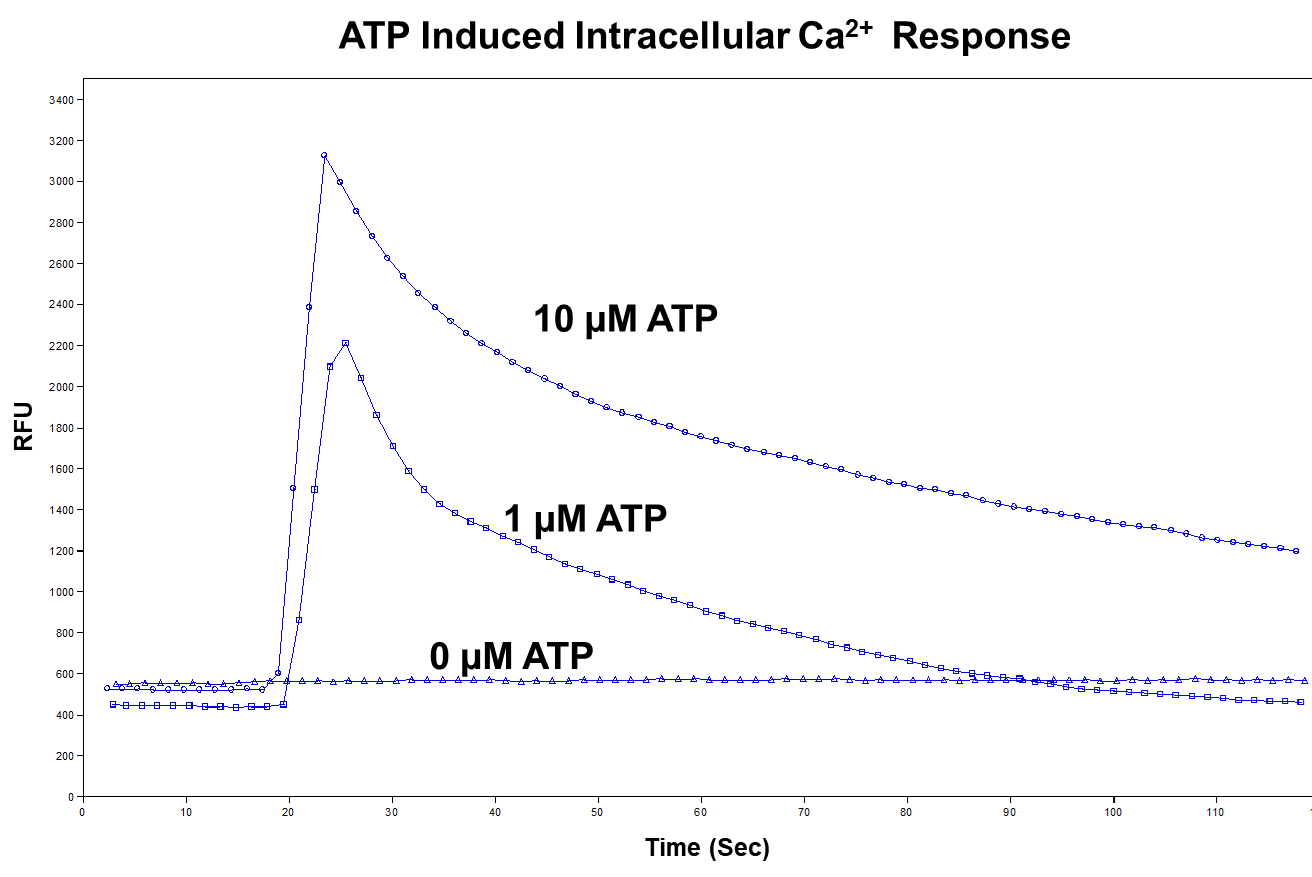
- Flexstation at Ex/Em=490/525 nm by injecting 50 µL of ATP in each well. The plate is read before and after the addition of ATP at 1.5 second interval for 120 seconds. Please see the graph below:
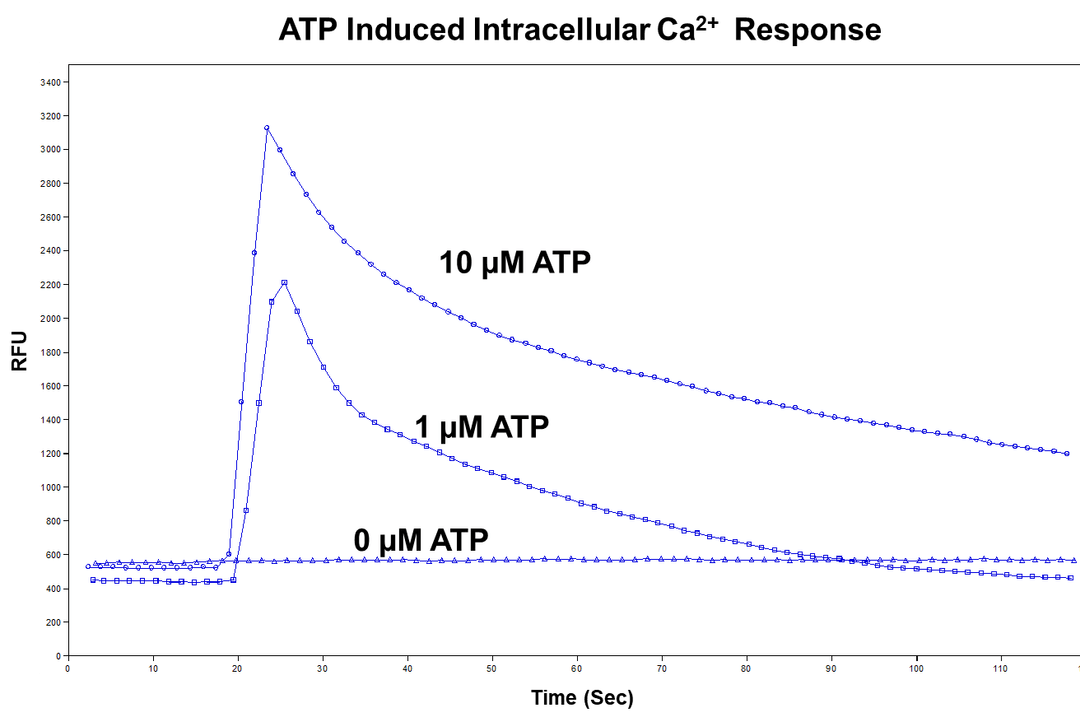 ATP induced intracellular Ca2+ Response
 - Fluorescent microscope in FITC channel. The images are taken before and after the addition of 50 µL of ATP.
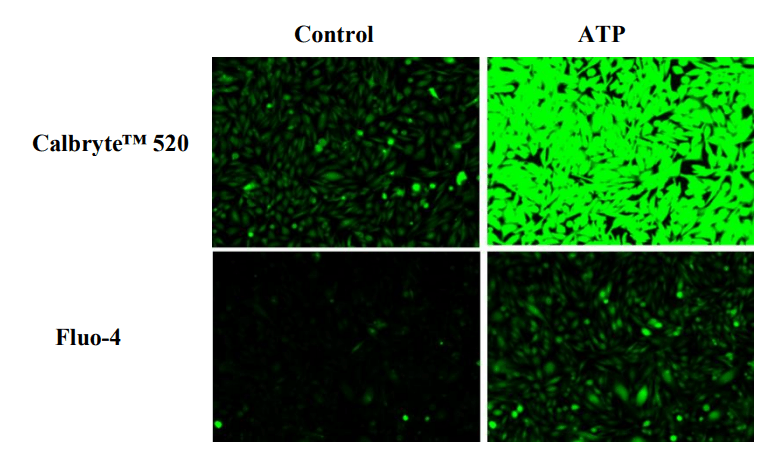 Before and after aaddition of 50 ul of ATP
- Flexstation at Ex/Em=490/525 nm by injecting 50 µL of ATP in each well. The plate is read before and after the addition of ATP at 1.5 second interval for 120 seconds. Please see the graph below:

Original created on October 16, 2017, last updated on October 16, 2017
Tagged under: