Monitoring of Mitochondrial Membrane Potential Changes in Live Cells Using JC-10
by Chunmei Wei, Qin Zhao, Xing Han, Zhenjun Diwu, Jinfang Liao
Mitochondrial membrane potential is a key indicator of cell health and mitochondrial permeability transition which is an important step in the induction of cellular apoptosis. JC-1, a lipophilic cationic dye, is widely used to detect mitochondrial depolarization. However its extremely poor water solubility make it precipitate in aqueous buffer even at 1 µM concentration. This unfavorable property makes JC-1 hard to be used for some biological applications, especially for imagebased and fluorescence microplate reader-based applications in which complete removal of un-dissolved fluorescent particles is highly desirable for obtaining accurate data.
JC-10 has been developed to improve the poor water solubility of JC-1. Compared to JC-1, JC-10 has much better water solubility. As in the case of JC-1, JC-10 is capable of entering selectively into mitochondria, and changes reversibly its color from green to orange as membrane potentials increase. This property is due to the reversible formation of JC-10 aggregates upon membrane polarization that causes shifts in emitted light from 520 nm (i.e., emission of JC-10 monomeric form) to 570 nm (i.e., emission of J-aggregate). When excited at 490 nm, the color of JC-10 changes reversibly from green to greenish orange as the mitochondrial membrane becomes more polarized. Both fluorescence colors can be detected using the filters commonly available in flow cytometers, microscopes and microplate readers. For flow cytometers the green emission can be analyzed in fluorescence channel 1 (FL1) and greenish orange emission in channel 2 (FL2). Besides its potential use in flow cytometry, JC-10 can also be used in fluorescence imaging and fluorescence microplate platform where JC-1 has not been widely used due to its poor water solubility.
We have developed an assay kit to enable the use of JC-10 for monitoring the mitochondrial membrane potential with a microplate reader (rather than a flow cytometer). JC-10 outperforms JC-1 in several different cell types (e.g., primary rat hepatocytes, CHO-K1, HeLa, Jurkat and HepG2 cell lines). Assays were performed on a fluorescence plate reader and fluorescence microscope. In most of the cell lines JC-10 has superior signal to background ratios.
JC-10 is a novel fluorescent probe that can be used for detecting mitochondrial membrane potential change in a similar mechanism as JC-1. Compared to JC-1, JC-10 has the following benefits and features:
Original created on January 16, 2010, last updated on January 16, 2010
Tagged under:
Introduction
Mitochondrial membrane potential is a key indicator of cell health and mitochondrial permeability transition which is an important step in the induction of cellular apoptosis. JC-1, a lipophilic cationic dye, is widely used to detect mitochondrial depolarization. However its extremely poor water solubility make it precipitate in aqueous buffer even at 1 µM concentration. This unfavorable property makes JC-1 hard to be used for some biological applications, especially for imagebased and fluorescence microplate reader-based applications in which complete removal of un-dissolved fluorescent particles is highly desirable for obtaining accurate data.
JC-10 has been developed to improve the poor water solubility of JC-1. Compared to JC-1, JC-10 has much better water solubility. As in the case of JC-1, JC-10 is capable of entering selectively into mitochondria, and changes reversibly its color from green to orange as membrane potentials increase. This property is due to the reversible formation of JC-10 aggregates upon membrane polarization that causes shifts in emitted light from 520 nm (i.e., emission of JC-10 monomeric form) to 570 nm (i.e., emission of J-aggregate). When excited at 490 nm, the color of JC-10 changes reversibly from green to greenish orange as the mitochondrial membrane becomes more polarized. Both fluorescence colors can be detected using the filters commonly available in flow cytometers, microscopes and microplate readers. For flow cytometers the green emission can be analyzed in fluorescence channel 1 (FL1) and greenish orange emission in channel 2 (FL2). Besides its potential use in flow cytometry, JC-10 can also be used in fluorescence imaging and fluorescence microplate platform where JC-1 has not been widely used due to its poor water solubility.
We have developed an assay kit to enable the use of JC-10 for monitoring the mitochondrial membrane potential with a microplate reader (rather than a flow cytometer). JC-10 outperforms JC-1 in several different cell types (e.g., primary rat hepatocytes, CHO-K1, HeLa, Jurkat and HepG2 cell lines). Assays were performed on a fluorescence plate reader and fluorescence microscope. In most of the cell lines JC-10 has superior signal to background ratios.
Materials and Methods
- CHO-M1, Hela, HepG2, and Jurkat cells were plated at 96-well black wall/clear bottom costar plate at 37oC, 5% CO2 incubator for overnight. Primary rat hepatocytes plated on a 96-well plate were handled according to manufacturer's suggestion.
- Dye-loading: After overnight incubation, culture medium was removed. For kinetic assays, 10 µM of JC-10 or JC-1 in 100 µL of 1X HBSS with 20 mM HEPES was added into each well. The cells were dye-loaded at 37°C for 30 min. For endpoint assays, cells were treated with 50 µL of medium containing compound before dye-loaded with 50 µL of 20 µM JC-10 or JC-1for 30 min. Cells were washed twice with buffer after dye loading.
- Run the experiments on FlexStation (Molecular Devices) using Green channel: Excitation: 485 nm; Emission: 530 nm; Cutoff 515 nm; Red channel: Excitation: 485 nm; Emission: 590 nm; Cutoff 570 nm. Or BMG NOVOstar microplate reader at Ex 485nm/Em 520 and 595nm, or a FACSCalibur (Becton Dickinson, San Jose, CA).

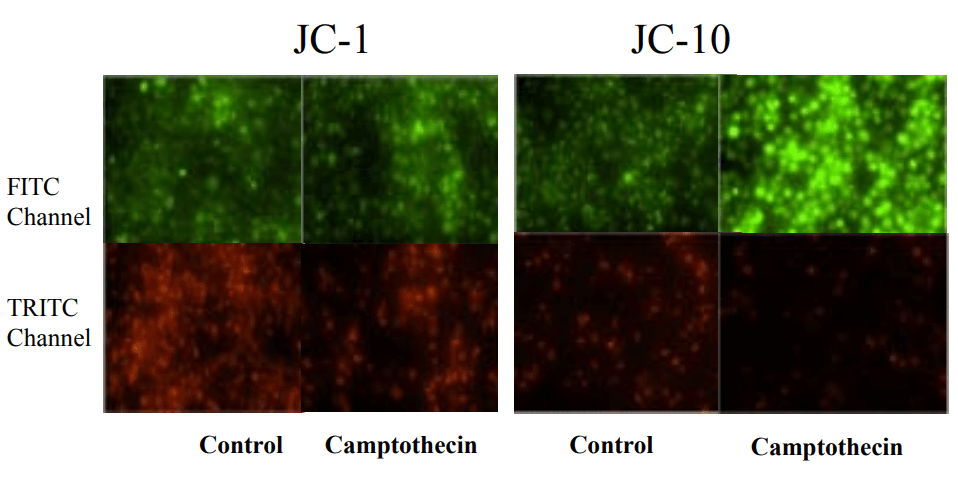
Campotothecin-induced mitochondria membrane potential changes monitored by JC-10 and JC-1 in JurKat cells. Jurkat cells were treated with 10 µM camptothecin for 4 hours. JC-1 and JC-10 dye loading solution was added to the wells for 30 minutes. Images acquired with a fluorescence microscope (Olympus IX71) using FITC and TRITC channel with a 20X objective.

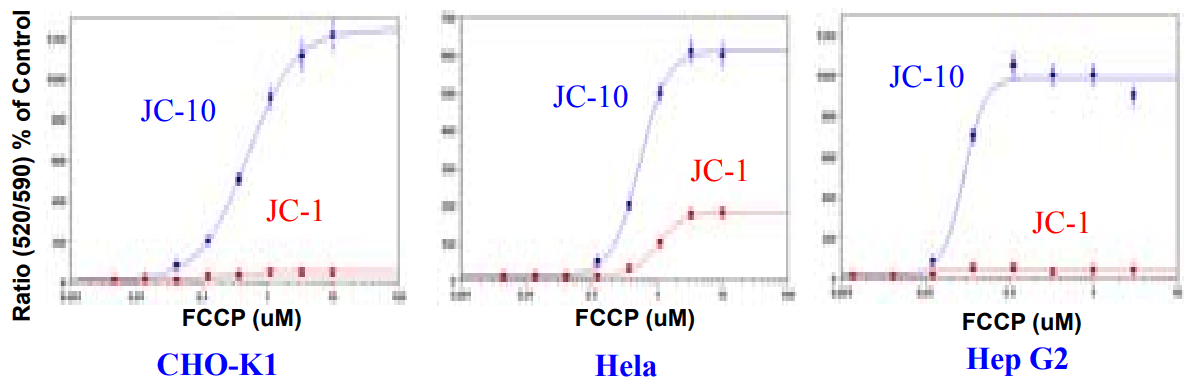
FCCP Dose Response in CHO-K1, Hela, and HepG2 cell lines using JC-10 or JC-1 (Kinetic Assays). CHO-K1, Hela and HepG2 cells were seeded overnight in 30,000 cells per 100 µl per well in a 96-well black wall/clear bottom costar plate. Growth medium was removed from plate, 100 µL of 10 µM of JC-10 or JC-1 were added into each well. The cells were dye-loaded at 37°C for 30 min. FCCP were added by FlexStation to achieve the final indicated concentrations.

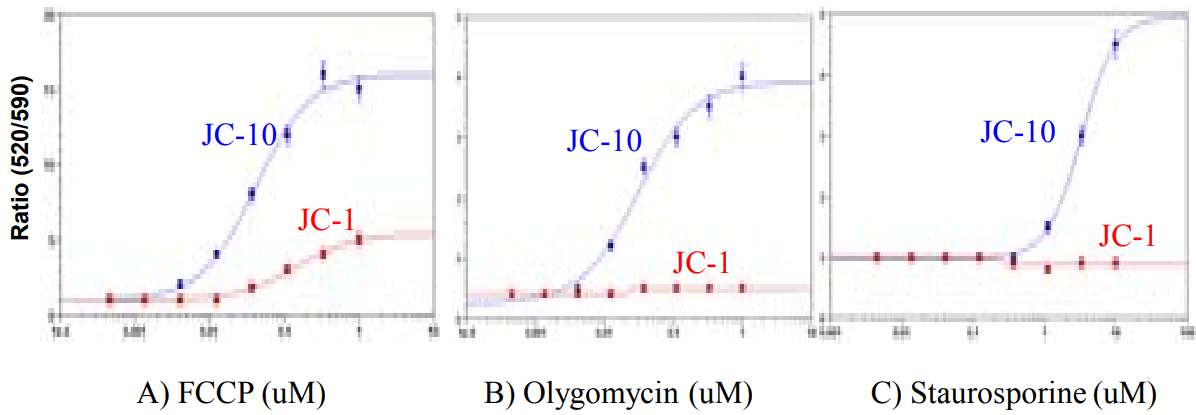
FCCP, oligomycin, and staurosporine dose response in Hela cells using JC10 or JC-1 (endpoint assay). Hela cells were seeded overnight in 20,000 cells per 100 µl per well in a 96-well black wall/clear bottom costar plate. Cells were treated with 50 µL: A) FCCP for 30 minutes, B) Olygomycin for 30 minutes, and C) Staurosporine for 5 h after being serum starved for 18 h. 50 µL of 20 µM of JC-10 or JC-1 were added into each well. The cells were dye-loaded at 37°C for 30 min. Fluorescence signals were recorded by a FlexStation.

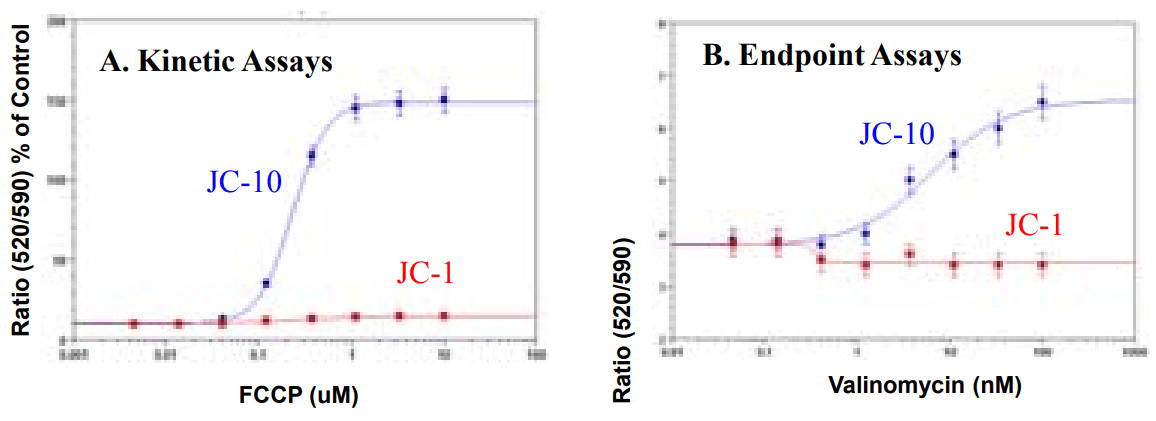
FCCP or valinomycin dose response in primary rat hepatocytes by using JC-10 or JC-1 (kinetic vs. endpoint Assays). Primary rat hepatocytes were plated on a 96-well plate according to manufacturer's suggestion. A) Kinetic assay: FCCP were added by FlexStation to achieve the final indicated concentrations. B) Endpoint assay: cells treated with valinomycin for 30 min. fluorescence signals were recorded by a FlexStation. Ratios of green and red fluorescence intensity were calculated by SoftMaxPro.

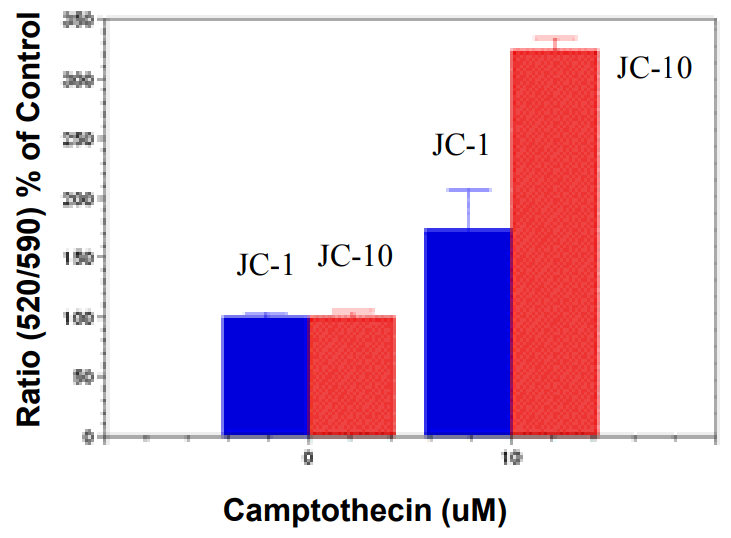
JC-10 and JC-1 comparison for monitoring campotothecin-induced mitochondria membrane potential changes in JurKat cells. Jurkat cells were treated with 10 µM camptothecin for 4 hours. JC-1 and JC-10 dye loading solution was added to the corresponding wells for 30 minutes. The fluorescence intensity for both J-aggregates and monomeric forms of JC-1 and JC-10 was measured with BMG NOVOstar microplate reader at Ex 485nm/Em 520 and 595nm.

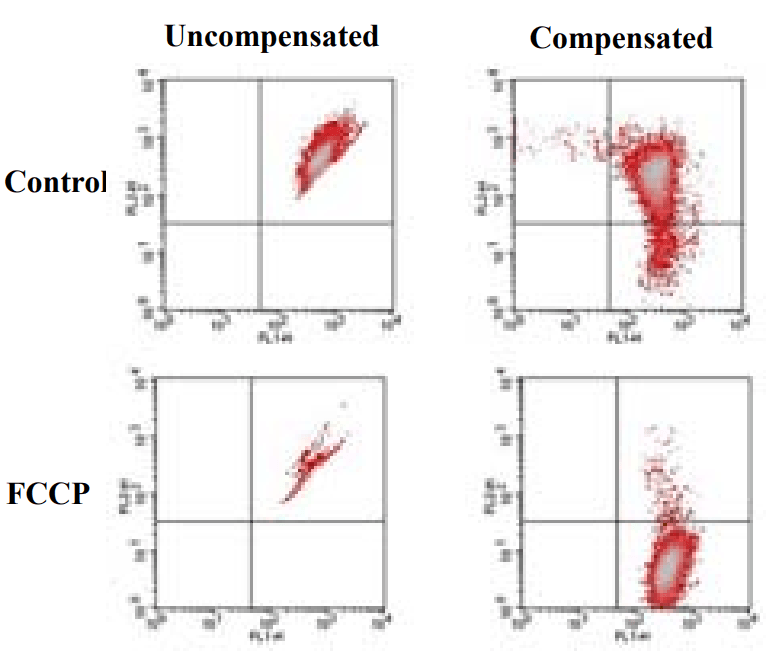
Flow Cytometric analysis on effect of FCCP induced mitochondria membrane potential change using JC-10. Jurkat cells were dye-loaded with JC-10 solution along with DMSO (Top) or 5 µM FCCP (Low) for 10 minutes. The fluorescence intensity for both Jaggregate and monomeric forms of JC-10 were measured with a FACSCalibur (Becton Dickinson, San Jose, CA) flow cytometer using FL1 and FL2 channels. Uncompensated data (left column) were compared with compensated data (right column).
Summary
JC-10 is a novel fluorescent probe that can be used for detecting mitochondrial membrane potential change in a similar mechanism as JC-1. Compared to JC-1, JC-10 has the following benefits and features:
- Ease of Use: JC-10 does not precipitate when diluted into aqueous buffers, eliminating artifacts.
- Robust: JC 10 has smaller assay deviations due to its enhanced water solubility and higher sensitivity.
- Enhanced Signal: JC-10 has higher signal to background ratio and better sensitivity than JC-1 in most of the tested cell lines.
- Broad Applications: JC-10 can be used for primary rat hepatocytes.
- User-Friendly: JC-10 is compatible with fluorescence plate readers, cell imagers and flow cytometers.
Original created on January 16, 2010, last updated on January 16, 2010
Tagged under: