Protonex™ Green 500, SE
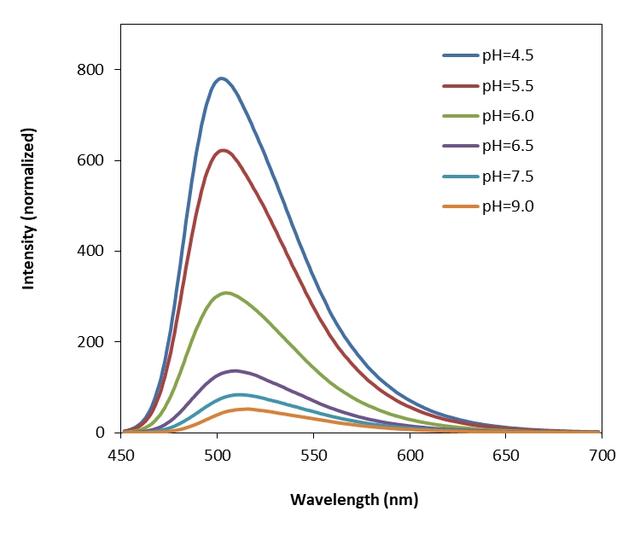
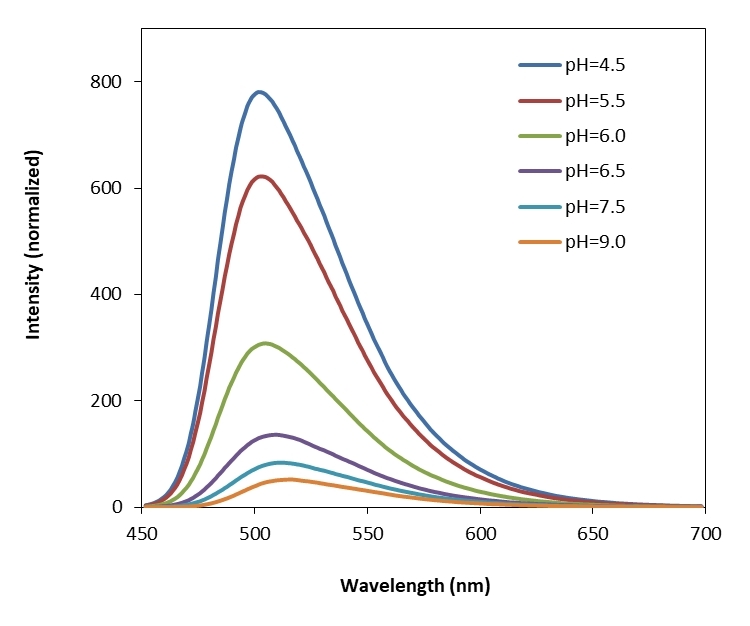
Protonex™ Green dye demonstrated pH-dependent fluorescence. Unlike most of the existing fluorescent dyes that are more fluorescent at higher pH, acidic conditions enhance the fluorescence of Protonex™ Green dye. The fluorescence of Protonex™ Green dye increases as pH decreases from neutral to the acidic. The lack of fluorescence outside the cell eliminates the wash steps. Protonex™ Green dye provides a powerful tool to monitor acidic cell compartments such as endosomes and lysosomes. Protonex™ Green dye is non-fluorescent outside the cells, but fluoresces brightly green in acidic compartments (such as phagosomes, lysosomes and endosomes). This Protonex™ Green enables the specific detection of cellular acidic compartments with reduced signal variability and improved accuracy for imaging or flow applications. Protonex™ Green has the spectral properties similar to those of FITC, making the common filter set of FITC readily available to the assays of Protonex™ Green. This amino-reactive Protonex™ Green derivative can be used for preparing Protonex™ Green conjugates as fluorescent pH probes.
Example protocol
PREPARATION OF STOCK SOLUTIONS
Unless otherwise noted, all unused stock solutions should be divided into single-use aliquots and stored at -20 °C after preparation. Avoid repeated freeze-thaw cycles.
1. Protein stock solution (Solution A)
Mix 100 µL of a reaction buffer (e.g., 1 M sodium carbonate solution or 1 M phosphate buffer with pH ~9.0) with 900 µL of the target protein solution (e.g. antibody, protein concentration >2 mg/mL if possible) to give 1 mL protein labeling stock solution. Note: The pH of the protein solution (Solution A) should be 8.5 ± 0.5. If the pH of the protein solution is lower than 8.0, adjust the pH to the range of 8.0-9.0 using 1 M sodium bicarbonate solution or 1 M pH 9.0 phosphate buffer. Note: The protein should be dissolved in 1X phosphate buffered saline (PBS), pH 7.2-7.4. If the protein is dissolved in Tris or glycine buffer, it must be dialyzed against 1X PBS, pH 7.2-7.4, to remove free amines or ammonium salts (such as ammonium sulfate and ammonium acetate) that are widely used for protein precipitation. Note: Impure antibodies or antibodies stabilized with bovine serum albumin (BSA) or gelatin will not be labeled well. The presence of sodium azide or thimerosal might also interfere with the conjugation reaction. Sodium azide or thimerosal can be removed by dialysis or spin column for optimal labeling results. Note: The conjugation efficiency is significantly reduced if the protein concentration is less than 2 mg/mL. For optimal labeling efficiency the final protein concentration range of 2-10 mg/mL is recommended.2. Protonex™ Green 500, SE stock solution (Solution B)
Add anhydrous DMSO into the vial of Protonex™ Green 500, SE to make a 10 mM stock solution. Mix well by pipetting or vortex. Note: Prepare the dye stock solution (Solution B) before starting the conjugation. Use promptly. Extended storage of the dye stock solution may reduce the dye activity. Solution B can be stored in freezer for two weeks when kept from light and moisture. Avoid freeze-thaw cycles.SAMPLE EXPERIMENTAL PROTOCOL
This labeling protocol was developed for the conjugate of Goat anti-mouse IgG with Protonex™ Green 500, SE. You might need further optimization for your particular proteins. Note: Each protein requires distinct dye/protein ratio, which also depends on the properties of dyes. Over labeling of a protein could detrimentally affects its binding affinity while the protein conjugates of low dye/protein ratio gives reduced sensitivity.
Run conjugation reaction
- Use 10:1 molar ratio of Solution B (dye)/Solution A (protein) as the starting point: Add 5 µL of the dye stock solution (Solution B, assuming the dye stock solution is 10 mM) into the vial of the protein solution (95 µL of Solution A) with effective shaking. The concentration of the protein is ~0.05 mM assuming the protein concentration is 10 mg/mL and the molecular weight of the protein is ~200KD. Note: We recommend to use 10:1 molar ratio of Solution B (dye)/Solution A (protein). If it is too less or too high, determine the optimal dye/protein ratio at 5:1, 15:1 and 20:1 respectively.
- Continue to rotate or shake the reaction mixture at room temperature for 30-60 minutes.
Purify the conjugation
The following protocol is an example of dye-protein conjugate purification by using a Sephadex G-25 column.- Prepare Sephadex G-25 column according to the manufacture instruction.
- Load the reaction mixture (From "Run conjugation reaction") to the top of the Sephadex G-25 column.
- Add PBS (pH 7.2-7.4) as soon as the sample runs just below the top resin surface.
- Add more PBS (pH 7.2-7.4) to the desired sample to complete the column purification. Combine the fractions that contain the desired dye-protein conjugate. Note: For immediate use, the dye-protein conjugate need be diluted with staining buffer, and aliquoted for multiple uses. Note: For longer term storage, dye-protein conjugate solution need be concentrated or freeze dried.
Calculators
Common stock solution preparation
Table 1. Volume of DMSO needed to reconstitute specific mass of Protonex™ Green 500, SE to given concentration. Note that volume is only for preparing stock solution. Refer to sample experimental protocol for appropriate experimental/physiological buffers.
| 0.1 mg | 0.5 mg | 1 mg | 5 mg | 10 mg | |
| 1 mM | 185.343 µL | 926.715 µL | 1.853 mL | 9.267 mL | 18.534 mL |
| 5 mM | 37.069 µL | 185.343 µL | 370.686 µL | 1.853 mL | 3.707 mL |
| 10 mM | 18.534 µL | 92.672 µL | 185.343 µL | 926.715 µL | 1.853 mL |
Molarity calculator
Enter any two values (mass, volume, concentration) to calculate the third.
| Mass (Calculate) | Molecular weight | Volume (Calculate) | Concentration (Calculate) | Moles | ||||
| / | = | x | = |
Spectrum

Product family
| Name | Excitation (nm) | Emission (nm) | Extinction coefficient (cm -1 M -1) |
| Protonex™ Green 500 Dextran | 445 | 503 | 4000 |
Citations
View all 1 citations: Citation Explorer
PHD2 is a regulator for glycolytic reprogramming in macrophages
Authors: Guentsch, Annemarie and Beneke, Angelika and Swain, Lija and Farhat, Katja and Nagarajan, Shunmugam and Wielockx, Ben and Raithatha, Kaamini and Dudek, Jan and Rehling, Peter and Zieseniss, Anke and others, undefined
Journal: Molecular and Cellular Biology (2016): MCB--00236
Authors: Guentsch, Annemarie and Beneke, Angelika and Swain, Lija and Farhat, Katja and Nagarajan, Shunmugam and Wielockx, Ben and Raithatha, Kaamini and Dudek, Jan and Rehling, Peter and Zieseniss, Anke and others, undefined
Journal: Molecular and Cellular Biology (2016): MCB--00236
References
View all 56 references: Citation Explorer
Monitoring phospholipid dynamics during phagocytosis: application of genetically-encoded fluorescent probes
Authors: Sarantis H, Grinstein S.
Journal: Methods Cell Biol (2012): 429
Authors: Sarantis H, Grinstein S.
Journal: Methods Cell Biol (2012): 429
Phagocytosis and digestion of pH-sensitive fluorescent dye (Eos-FP) transfected E. coli in whole blood assays from patients with severe sepsis and septic shock
Authors: Schreiner L, Huber-Lang M, Weiss ME, Hohmann H, Schmolz M, Schneider EM.
Journal: J Cell Commun Signal (2011): 135
Authors: Schreiner L, Huber-Lang M, Weiss ME, Hohmann H, Schmolz M, Schneider EM.
Journal: J Cell Commun Signal (2011): 135
The application of fluorescent probes for the analysis of lipid dynamics during phagocytosis
Authors: Flannagan RS, Grinstein S.
Journal: Methods Mol Biol (2010): 121
Authors: Flannagan RS, Grinstein S.
Journal: Methods Mol Biol (2010): 121
Quantification of microsized fluorescent particles phagocytosis to a better knowledge of toxicity mechanisms
Authors: Leclerc L, Boudard D, Pourchez J, Forest V, Sabido O, Bin V, Palle S, Grosseau P, Bernache D, Cottier M.
Journal: Inhal Toxicol (2010): 1091
Authors: Leclerc L, Boudard D, Pourchez J, Forest V, Sabido O, Bin V, Palle S, Grosseau P, Bernache D, Cottier M.
Journal: Inhal Toxicol (2010): 1091
Analysis of macrophage phagocytosis: quantitative assays of phagosome formation and maturation using high-throughput fluorescence microscopy
Authors: Steinberg BE, Grinstein S.
Journal: Methods Mol Biol (2009): 45
Authors: Steinberg BE, Grinstein S.
Journal: Methods Mol Biol (2009): 45
Page updated on September 17, 2025