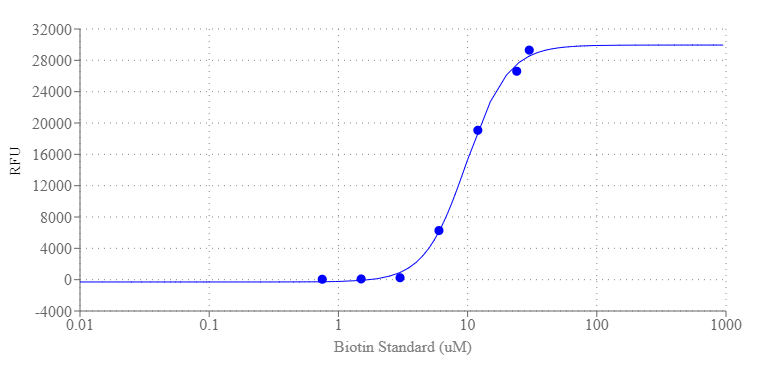
Portelite™ Rapid Fluorimetric Biotin Quantitation Kit is specifically optimized to quantify biotin and biotin conjugates with a portal fluorometer such as CytoCite™ and Qubit™ Fluorometer. The kit uses Biotinylite™ Green, a fluorogenic biotin sensor. Biotinylite™ Green is almost non-fluorescent and give strong green fluorescence upon interaction with a biotin or biotin conjugate. The concentration of biotin is proportional to the fluorescence intensity of Biotinylite™ Green. The amount of biotin is determined by comparing a sample’s fluorescence to the predetermined biotin standard curve. This fluorescence-based assay is much more sensitive than the commonly used colorimetric HABA assay. Biotin is a relatively small molecule that is routinely conjugated to antibodies and proteins with minimal interference of their biological activity. The avidin/streptavidin-biotin interaction is the strongest known binding pair between a protein and its ligand. The biotin-avidin interaction has been extensively explored for a variety of biological applications.
| Catalog | Size | Price | Quantity |
|---|---|---|---|
| 5539 | 50 tests | Price |
| Intended use | Research Use Only (RUO) |
| Qubit Fluorometer | |
| Excitation | 490 nm |
| Emission | 530 nm |
| Instrument specification(s) | Green Fluorescent Channel |
| Telephone | |
| Fax | |
| sales@aatbio.com | |
| International | See distributors |
| Bulk request | Inquire |
| Custom size | Inquire |
| Technical Support | Contact us |
| Request quotation | Request |
| Purchase order | Send to sales@aatbio.com |
| Shipping | Standard overnight for United States, inquire for international |