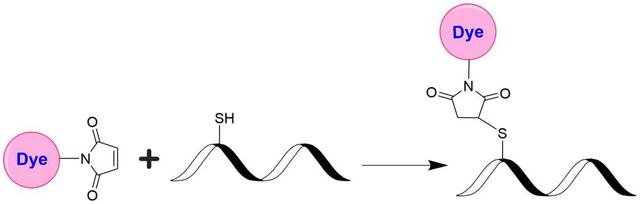
trFluor™ Tb maleimide
Example protocol
PREPARATION OF STOCK SOLUTIONS
Unless otherwise noted, all unused stock solutions should be divided into single-use aliquots and stored at -20 °C after preparation. Avoid repeated freeze-thaw cycles
Add anhydrous DMSO into the vial of trFluor™ Tb maleimide to make a 10 mM stock solution. Mix well by pipetting or vortex.
Note: For optimal results, prepare the dye stock solution (Solution B) before starting the conjugation process. Remember to use it promptly, as extended storage of the dye stock solution may reduce its reactivity. Solution B can be stored in the freezer for up to 4 weeks, protected from light and moisture. Avoid freeze-thaw cycles.
Mix 100 µL of a reaction buffer (e.g., 100 mM MES buffer with pH ~6.0) with 900 µL of the target protein solution (e.g., antibody, protein concentration >2 mg/mL if possible) to give a 1 mL protein labeling stock solution.
Note: The pH of the protein labeling stock solution solution (Solution A) should be 6.5 ± 0.5.
Note: Impure antibodies or antibodies stabilized with bovine serum albumin (BSA) or other proteins will not be labeled well.
Note: The conjugation efficiency is significantly reduced if the protein concentration is less than 2 mg/mL. For optimal labeling efficiency, it is recommended that the final protein concentration range between 2-10 mg/mL.
Optional. If your protein does not already contain a free cysteine, treating it with either DTT or TCEP is necessary to generate a thiol group. This process converts a disulfide bond into two free thiol groups. If DTT is used, it is important to remove any excess free DTT by dialysis or gel filtration before conjugating a dye maleimide to the protein. Below is a sample protocol for generating a free thiol group:
- Prepare a fresh solution of 1 M DTT (15.4 mg/100 µL) in distilled water.
- To make an IgG solution in 20 mM DTT, add 20 µL of DTT stock per ml of IgG solution while mixing. Let the solution stand at room temperature for 30 minutes without additional mixing (to minimize the reoxidation of cysteines to cystines).
- Pass the reduced IgG over a filtration column preequilibrated with "Exchange Buffer". Collect 0.25 mL fractions off the column.
- Determine the protein concentrations and pool the fractions with the majority of the IgG. This can be done either spectrophotometrically or colorimetrically.
- Carry out the conjugation as soon as possible after this step (see Sample Experiment Protocol).
Note: For the best results, IgG solutions should be >4 mg/mL. If the antibody is less than 2 mg/mL, it should be concentrated. Include an extra 10% for losses on the buffer exchange column.
Note: The reduction can be carried out in almost any buffer from pH 7 to 7.5, e.g., MES, phosphate, or TRIS buffers.
Note: Steps 3 and 4 can be replaced by dialysis.
SAMPLE EXPERIMENTAL PROTOCOL
This protocol was developed for the labeling of goat anti-mouse IgG with trFluor™ Tb maleimide. Further optimization may be required for your specific proteins.
Note: Each protein requires a distinct dye/protein ratio, which also depends on the properties of dyes. Over-labeling of a protein could detrimentally affect its binding affinity while the protein conjugates of low dye/protein ratio give reduced sensitivity.
Use a 10:1 molar ratio of Solution B (dye):Solution A (protein) as the starting point. Add 5 µL of the dye stock solution (Solution B, assuming the dye stock solution is 10 mM) to the vial of the protein solution (95 µL of Solution A) with effective shaking. The protein concentration is ~0.05 mM, assuming the protein concentration is 10 mg/mL and the protein molecular weight is ~200KD.
Note: We recommend using a 10:1 molar ratio of Solution B (dye) to Solution A (protein). If the ratio is too low or too high, determine the optimal dye/protein ratio at 5:1, 15:1, and 20:1, respectively.
Continue to rotate or shake the reaction mixture at room temperature for 30-60 minutes.
The following protocol is an example of dye-protein conjugate purification by using a Sephadex G-25 column.
Prepare the Sephadex G-25 column according to the manufacturer's instructions.
Load the reaction mixture (from the "Run Conjugation Reaction" section) to the top of the Sephadex G-25 column.
Add PBS (pH 7.2-7.4) as soon as the sample runs just below the top resin surface.
Add more PBS (pH 7.2-7.4) to the desired sample to complete the column purification. Combine the fractions that contain the
desired dye-protein conjugate.Note: For immediate use, the dye-protein conjugate should be diluted with staining buffer and aliquoted for multiple uses.
Note: For longer-term storage, the dye-protein conjugate solution needs to be concentrated or freeze-dried.
Determining the Degree of Substitution (DOS) is crucial in characterizing dye-labeled proteins. Lower DOS proteins tend to
have weaker fluorescence, but higher DOS proteins may also have reduced fluorescence. For most antibodies, the optimal DOS is between 2 and 10, depending on the dye and protein properties. For effective labeling, the degree of substitution should be controlled to have 5-8 moles of trFluor™ Tb maleimide to one mole of antibody. The following steps are used to determine the DOS of trFluor™ Tb maleimide-labeled proteins:
Measure absorption—To measure the absorption spectrum of a dye-protein conjugate, the sample concentration should
be kept between 1 and 10 µM, depending on the dye's extinction coefficient.Read OD (absorbance) at 280 nm and dye maximum absorption (ƛmax = 544 nm for trFluor™ Tb dyes). For most spectrophotometers, the sample (from the column fractions) must be diluted with de-ionized water so that the OD values range from 0.1 to 0.9. The O.D. (absorbance) at 280 nm is the maximum absorption of protein, while 544 nm is the maximum absorption of trFluor™ Tb maleimide. To obtain accurate DOS, ensure the conjugate is free of the non-conjugated dye.
Calculate DOS using our DOS calculator: https://www.aatbio.com/tools/degree-of-labeling-calculator
Calculators
Common stock solution preparation
| 0.1 mg | 0.5 mg | 1 mg | 5 mg | 10 mg | |
| 1 mM | 63.381 µL | 316.907 µL | 633.814 µL | 3.169 mL | 6.338 mL |
| 5 mM | 12.676 µL | 63.381 µL | 126.763 µL | 633.814 µL | 1.268 mL |
| 10 mM | 6.338 µL | 31.691 µL | 63.381 µL | 316.907 µL | 633.814 µL |
Molarity calculator
| Mass (Calculate) | Molecular weight | Volume (Calculate) | Concentration (Calculate) | Moles | ||||
| / | = | x | = |
Spectrum

Product family
| Name | Excitation (nm) | Emission (nm) | Extinction coefficient (cm -1 M -1) | Correction Factor (260 nm) | Correction Factor (280 nm) |
| trFluor™ Eu maleimide *europium complex* | 298 | 617 | 21000 | 0.911 | 0.777 |
References
Authors: Lo MC, Ngo R, Dai K, Li C, Liang L, Lee J, Emkey R, Eksterowicz J, Ventura M, Young SW, Xiao SH.
Journal: Anal Biochem (2012): 368
Authors: Saville L, Spais C, Mason JL, Albom MS, Murthy S, Meyer SL, Ator MA, Angeles TS, Husten J.
Journal: Assay Drug Dev Technol. (2012)
Authors: Paila YD, Kombrabail M, Krishnamoorthy G, Chattopadhyay A.
Journal: J Phys Chem B (2011): 11439
Authors: Martikkala E, Rozw and owicz-Jansen A, Hanninen P, Petaja-Repo U, Harma H.
Journal: J Biomol Screen (2011): 356
Authors: Gaborit N, Larbouret C, Vallaghe J, Peyrusson F, Bascoul-Mollevi C, Crapez E, Azria D, Chardes T, Poul MA, Mathis G, Bazin H, Pelegrin A.
Journal: J Biol Chem (2011): 11337