A practical guide for use of PE and APC in flow cytometry
In this issue
Latest News and Events: Update to Spectrum Viewer
Calbryte™ series now available
A practical guide for use of PE and APC in flow cytometry
Selecting the right ROS probe
A highly sensitive direct ELISA of cAMP without acetylation
Quantitative comparison of iFluor™ 488- and FITC- conjugated antibodies for use in cell labeling
AssayWise Letters 2017, Vol. 6(2)
Flow cytometry and fluorescence activated cell sorting (FACS) have enabled an unprecedented level of analysis in cell biology. With these tools, entire cell populations can be screened and characterized on a cell-by-cell basis for specific, biologically-significant traits. It has become trivial to determine the percentage of viable cells in a given population, or to quantify the presence of a particular protein or marker. Indeed, flow cytometry provides a degree of specificity unachievable by traditional microplate reader platforms and with a practicality not afforded to microscopy. But perhaps the greatest advantage of flow cytometry is the ease by which multi-factor analysis can be accomplished.
Since its inception, researchers have been interested in flow cytometry's capability for multi-factor analysis. Due to the nature of flow cytometry (ie. single-cell analysis), it becomes possible to co-monitor several cellular events simultaneously within any given cell. For example, a cell can be screened for both apoptosis and surface marker expression. Because many biological processes are co-dependent and occur in tandem, the ability to study multiple variables in parallel is clearly advantageous.
In flow cytometry, multi-factor analysis, or multiplexing, is accomplished through the use of several fluorescent probes simultaneously. These fluorescent probes differ in their "color" that is, the wavelength at which they emit fluorescent light. Fluorescent probes are typically chosen for their brightness, expressed as the stain index, and their spectral separation from other probes in the multiplex panel. Of potential fluorophores, PE and APC have found great success in flow cytometry, both due to their individual brightness as well as their ability to create spectral separation when implemented as tandem dyes.
PE & APC
Phycoerythrin (PE) and allophycocyanin (APC) are members of a protein family called phycobiliproteins. This family of proteins is present in photosynthetic organisms, such as algae and cyanobacteria. In nature, they typically act as accessory proteins to chlorophyll pigments in photosynthesis. Structurally, phycobiliproteins are comprised of a protein complex covalently bound to phycobilins, the part which captures light energy. For use in flow cytometry, PE and APC are extracted from red algae and purified.
- Ext. Coeff. = molar extinction coefficient at their maximum absorption wavelength (Units = cm-1M-1).
- FQY = fluorescence quantum yield in aqueous buffer (pH 7.2).
PE
Phycoerythrin (PE) is available in two forms: R-PE and B-PE, though R-PE has found more use in flow cytometry (because of this, the shorthand PE is often used interchangeably with R-PE). PE has a molecular weight of 240,000 Daltons, with an extinction coefficient of 1,960,000 cm-1 M-1 and a quantum yield of 0.84. PE is maximally excited at 565 nm (with a secondary maximum at 495 nm) and emits at 573 nm, which is in the yellow-orange region of the visible spectrum. For comparison, free Cy3, which also fluoresces in the yellow-orange spectrum region, has an extinction coefficient of 150,000 cm-1 M-1 and a quantum yield of 0.20 (~0.40 when bound to DNA). Thus, compared to Cy3, PE is much "brighter". In fact, PE is, across most experimental conditions, the brightest fluorophore available for flow cytometry.
PE Excitation Spectrum

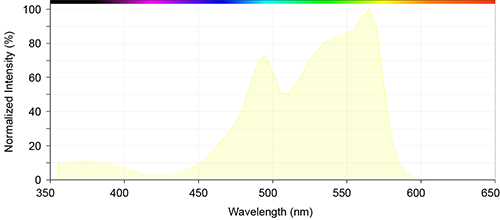
PE Emission Spectrum

Excitation and Emission Spectrum of Phycoerythrin
APC
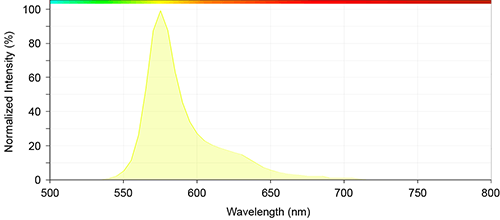
Allophycocyanin (APC) is a 105 kDa protein, with an extinction coefficient of 700,000 cm-1 M-1 and a quantum yield of 0.68. APC is maximally excited at 652 nm (with a secondary maximum at 625 nm) and emits at 658 nm. Its fluorescence falls in the red region of the visible spectrum. Compared to PE, APC is not as"bright". This is due in part to its lower extinction coefficient and quantum yield. It is also because APC is red-shifted compared to PE. Thus, the light source used to maximally excite APC will contain less energy than the one used to maximally excite PE. Compared to other red fluorophores such as Cy5, however, APC is still significantly brighter and an excellent choice for use in flow cytometry.
APC Excitation Spectrum

APC Emission Spectrum
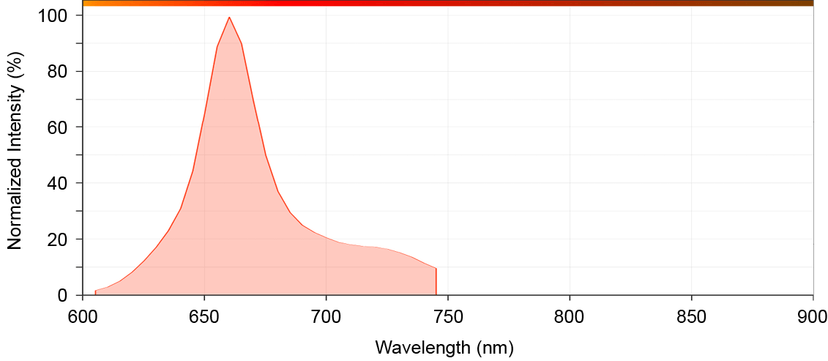

Excitation and Emission Spectrum of Allophycocyanin
Preparation of PE and APC For Use In Flow Cytometry
In order to be used for flow cytometry, PE or APC must first be conjugated to an antibody. The antibody serves as the detector for the target of interest, while the PE or APC acts as the reporter which translates the detected event into a quantifiable signal. Traditional methods of PE or APC conjugation to antibodies involve activation of PE or APC with SMCC. While not detailed here, the general process is as follows:
- Activate the reporter (PE or APC) with SMCC
- Reduce the detector (antibody or protein) with DTT
- Mix activated reporter with reduced detector
- Purify bioconjugate using dialysis
Though an established method, SMCC-based conjugation does suffer from several drawbacks. First, the conjugation efficiency is typically low, with a good yield resting at approximately 30% recovery. A second drawback is the need to reduce the antibodies with DTT, which may significantly impact their function. Finally, because the efficiency of SMCC-based reactions are typically low, very high concentrations of reactants (ie. PE and antibody) are required for adequate reactivity.
There are several alternatives to SMCC chemistry. These alternatives typically rely on first conjugating the reporter and detector independently, each with a different tag. These tags are typically chosen for their high affinity and specificity for each other and only each other, such that when the tagged reporter and detector are mixed, the tags bind, forming a bioconjugate between the reporter and the detector.
One fairly established usage of this type of tagging is the biotin-streptavidin conjugation system. In this system, an antibody is tagged, or labeled, with biotin. The detector, for example PE, is then labeled with streptavidin. Because of biotin's and streptavidin's high affinity for each other, they form a strong covalent bond, ultimately resulting, in this case, in an antibody-PE bioconjugate.
A second alternative to SMCC chemistry is AAT Bioquest's Buccutite™ technology. Similar to the biotin-streptavidin conjugation system, Buccutite™ technology relies on two separate tags: MTA and FOL. These two tags are independently labeled onto the reporter and detector, respectively, and when mixed will bind strongly to each other, resulting in a reporter-detector bioconjugate. Compared to other conjugation chemistries, Buccutite™ offers several unique advantages. First, Buccutite™ reactions typically have much higher yields, with final recovery more than double (>60%) that of SMCC methods. Moreover, because the reaction between MTA and FOL is very efficient, reactions can occur at very low concentrations of reactants (ie. <1 mg/mL of antibody).


Left: Flow cytometry analysis of HL-60 cells stained with 1 µg/mL Mouse IgG2a control (Green) or with 1 µg/mL Anti-Human HLA-ABC (Red) and then followed by Goat Anti-Mouse IgG-APC-Cy7 conjugate prepared with ReadiLink™ Rapid APC-Cy7 Tandem Antibody Labeling Kit (Cat No. 1321). Right: Flow cytometry analysis of HL-60 cells 1 µg/mL stained with Mouse IgG2a Control or with 1 µg/mL Anti-Human HLA-ABC and then followed by Goat Anti-Mouse IgG-PE-Cy5 conjugate prepared with ReadiLink™ Rapid PE-Cy5 Tandem Antibody Labeling Kit (Cat No. 1315).
Usage of PE and APC In Flow Cytometry
While the actual experimental procedure will differ depending on the experiment, there are some general guidelines to follow when using PE and APC for flow cytometry.
Determine the equipment specifications
The successful usage of PE and APC depends on the available laser and filter sets of the flow cytometer. For PE, this is typically a non-issue. This is because, while PE has a maximal excitation at 565 nm, it also has a secondary maximum at 495 nm. Thus, if the 568 nm krypton laser is not available, the extremely common 488 argon laser will suffice. For emission filter selection, PE can be read using the Cy3/TRITC filter (590/40).
For APC, the excitation source can vary depending on the available lasers. The 594 nm or 633 nm laser line are suitable. For emission filters, the Cy5 filter (660/40) is recommended.
Determine if compensation is necessary
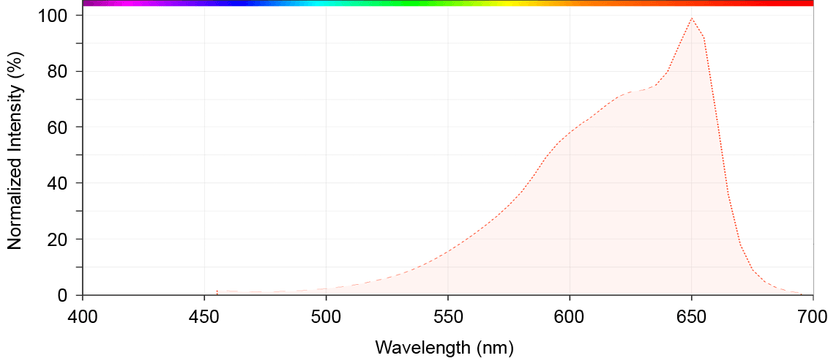
For multicolor analysis, compensation may be required before analyzing data. This is because two or more fluorophores may have overlapping emission spectra. In such cases, any signal read may in fact be due to the combination of multiple individual signals. Compensation accounts for this overlap by mathematically removing signals that "spillover" into the main signal of interest. Consider the following flow cytometry panel:
Here, there is a portion of spectral overlap between the PE emission and the propidium iodide (PI) emission. To account for, and remove the signal overlap, is the basis of compensation. Most modern instrumentation and software can automatically perform compensation if given the control parameters. In the case of the above example, this would entail first performing a run with just PE stained cells, then performing a run with just PI stained cells, before finally performing the two-color analysis.

Representation of overlapping emission spectra of PE (Yellow, Cat No. 2556) and PI (Cat No. 17516). Multicolor analysis may require compensation prior to data analysis. Compensation accounts for this overlap by removing signals that "spillover" into the main signal of interest. (Dotted yellow line: PE excitation profile; Dotted orange line: PI excitation profile; Yellow shaded region: PE emission profile; Orange shaded region: PI emission profile)
Use As Tandem Dyes
Tandem dyes refer to compounds in which two different fluorophores have been covalently linked. In this conformation, the excitation of one fluorophore (termed the "donor") results in the transfer of energy to, and the fluorescing of, the other (termed the "acceptor"). This transfer of energy from donor to acceptor occurs through Förster resonance energy transfer, or FRET. Though not elaborated upon here, the mechanism of FRET and its application in biological probes is well documented. In particular, FRET has been applied very successfully in studies of nucleotides and peptides. More recently, however, there has been an explosion of interest in FRET-based flow cytometry applications, particularly with PE and APC based tandem dyes.
The reason PE and APC based tandem dyes are particularly useful in flow cytometry is because of their unusually large Stoke's shifts. The Stoke's shift refers to the distance between the maximal excitation and the maximal emission. For a typical fluorophore, this difference is small, ranging between 10 to 50 nm on average. PE and APC based tandem dyes can achieve Stoke's shifts in the hundreds, depending on the fluorophore pair used. The large Stoke's shifts of tandem dyes is extremely valuable when design multicolor flow cytometry panels.
Consider the following three flow cytometry panels:
Table 3. Flow Cytometry Panel B
| Fluorophore ▲ ▼ | Ex (nm) ▲ ▼ | Em (nm) ▲ ▼ | Stoke's Shift (nm) ▲ ▼ |
| 5-FITC | 489 | 515 | 26 |
| GFP | 489 | 508 | 19 |
| Alexa Fluor 488 | 499 | 520 | 21 |
Panel A has good spectral separation amongst the three fluorophores; the three emission peaks are fairly far apart. This means that minimal compensation is required. However, because the three fluorophores have varying excitation maximums, an optimal experimental setup will require three different laser sources. This in practice is both expensive and inconvenient to set up.
Panel B has three fluorophores that can all be well excited by a singular laser source. In this case, the three fluorophores can all be excited by the extremely common 488 nm argon-ion laser. Thus in practice, the instrumentation for such a panel is fairly straightforward. However, panel B suffers from extensive spectral overlap; the emission peaks are too close. Such a panel will require very complex compensation calculations, if such calculations can be done at all.
Panel C demonstrates the power of tandem dyes (PE-Cy5 and PE-Cy7). In this panel, all three fluorophores can be well excited by the same laser line, as in panel B. However, unlike panel B, the three fluorophores demonstrate excellent spectral separation. This, as mentioned prior, is due to the large Stoke's shifts of the tandem dyes (171 nm and 283 nm). In panel C, the advantage of tandem dyes becomes evident, namely, tandem dyes allow for the use of multiple fluorophores that share an excitation maximum but do not require extensive compensation.

Absorption and emission spectra of FITC (Green), PE-Cy5 (Orange) and PE-Cy7 (Red). All three fluorophores can be well excited by the 488 nm laser line (Blue) with excellent spectral seperation.
Preparation of PE and APC Tandem Dyes
The common method of synthesizing tandem dyes is through use of succinimidyl esters (also called NHS esters). This is a common method to label small molecule fluorophores onto proteins and antibodies. In this method, the small molecule fluorophore becomes reactive due to the addition of the succinimidyl ester (SE) functional group. The fluorophore-SE then reacts to free amine groups on PE or APC, forming a covalent bond. Once the PE or APC tandem dye is synthesized, it can then be conjugated to an antibody using SMCC or related chemistries as mentioned previously.
Reactive succinimidyl esters of common small molecule fluorophores such as FITC, Cy dyes, Alexa Fluors and iFluors can be directly purchased. For convenience purposes, conjugated tandem dyes (such as PE-Cy5) and activated, conjugated tandem dyes (such as Buccutite™ PE-Cy5) are also available for purchase.
Table 5. Common PE and APC Tandem Dyes and Their Spectral Properties
| Product Name ▲ ▼ | Ex (nm) ▲ ▼ | Em (nm) ▲ ▼ | Stokes Shift (nm) ▲ ▼ | Ext. Coeff.1 ▲ ▼ | Unit Size ▲ ▼ | Cat No. ▲ ▼ |
| PE-iFluor® 594 | 495 | 604 | 109 | 1,960,000 | 1 mg | 2584 |
| PE-Texas Red | 495 | 615 | 120 | 1,960,000 | 1 mg | 2619 |
| PE-Cy5 | 495 | 666 | 171 | 1,960,000 | 1 mg | 2610 |
| PE-iFluor® 647 | 495 | 666 | 171 | 1,960,000 | 1 mg | 2577 |
| PE-Alexa Fluor® 647 | 495 | 666 | 171 | 1,960,000 | - | - |
| PE-Cy5.5 | 495 | 672 | 177 | 1,960,000 | 1 mg | 2613 |
| PE-iFluor® 660 | 495 | 677 | 182 | 1,960,000 | 1 mg | 2579 |
| PE-iFluor® 700 | 495 | 708 | 213 | 1,960,000 | 1 mg | 2585 |
| PE-Cy7 | 495 | 778 | 283 | 1,960,000 | 1 mg | 2616 |
| PE-iFluor® 750 | 495 | 778 | 283 | 1,960,000 | 1 mg | 2578 |