Cell Meter™ Fluorimetric Live Cell Cycle Assay Kit *Red Fluorescence Optimized for Flow Cytometry*
Ordering information
Price | |
Catalog Number | |
Unit Size | |
Quantity |
Additional ordering information
Telephone | 1-800-990-8053 |
Fax | 1-800-609-2943 |
sales@aatbio.com | |
International | See distributors |
Bulk request | Inquire |
Custom size | Inquire |
Shipping | Standard overnight for United States, inquire for international |
Spectral properties
Excitation (nm) | 542 |
Emission (nm) | 580 |
Storage, safety and handling
H-phrase | H303, H313, H333 |
Hazard symbol | XN |
Intended use | Research Use Only (RUO) |
R-phrase | R20, R21, R22 |
UNSPSC | 12352200 |
Alternative formats
Cell Meter™ Fluorimetric Live Cell Cycle Assay Kit *Green Fluorescence Optimized for Flow Cytometry* |
Cell Meter™ Fluorimetric Live Cell Cycle Assay Kit *Optimized for 405 nm Violet Laser Excitation* |
Related products
Overview | ![]() ![]() |
Excitation (nm) 542 | Emission (nm) 580 |
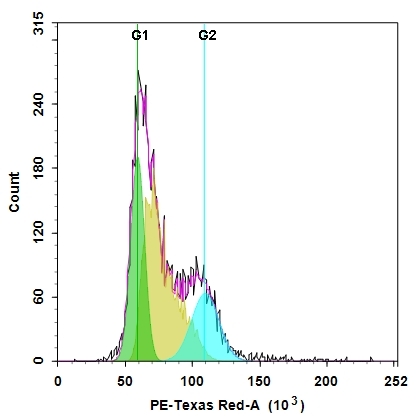
Cell cycles have four sequential phases: G0/G1, S, G2, and M. During a cell's passage through cell cycle, its DNA is duplicated in S (synthesis) phase and distributed equally between two daughter cells in M (mitosis) phase. These two phases are separated by two gap phases: G0/G1 and G2. The two gap phases provide time for cells to grow and double the mass of their proteins and organelles. They are also used by cells to monitor internal and external conditions before proceeding with the next phase of cell cycle. The cell's passage through cell cycles is controlled by a host of different regulatory proteins. This assay kit is designed to monitor cell cycle progression and proliferation by using our proprietary Nuclear Red™ CCS2 in live cells. The percentage of cells in a given sample that are in G0/G1, S and G2/M phases, as well as the cells in the sub-G1 phase prior to apoptosis can be determined by flow cytometry. Cells stained with Nuclear Red™ CCS2 can be monitored with a flow cytometer (PE-Texas Red channel).
Platform
Flow cytometer
Excitation | 488 nm laser |
Emission | 610/20 nm filter |
Instrument specification(s) | PE-Texas Red channel |
Components
Example protocol
AT A GLANCE
Protocol summary
- Prepare cells with test compounds at a density of 5 × 10⁵ to 1× 10⁶ cells/mL
- Add 1 µL of 500X Nuclear Red™ CCS2 into 0.5 mL of cell solution
- Incubate at 37 °C, 5% CO2 for 10 - 30 minutes
- Analyze cells using flow cytometer with PE-Texas Red channel (Ex/Em = 488 nm/615 nm)
Important notes
Thaw all the components at room temperature before starting the experiment.
SAMPLE EXPERIMENTAL PROTOCOL
- For each sample, prepare cells in 0.5 mL of warm medium or buffer of your choice at a density of 5×10⁵ to 1×10⁶ cells/mL. Note: Each cell line should be evaluated on an individual basis to determine the optimal cell density.
- Treat cells with test compounds for a desired period of time to induce apoptosis, cell cycle arrest or other cell cycle functions.
- Add 1 µL of 500X Nuclear Red™ CCS2 (Component A) in cells containing growth medium.
- Incubate the cells in a 37 °C, 5% CO2 incubator for 10 to 30 minutes. Note: For adherent cells, gently lift the cells with 0.5 mM EDTA to keep the cells intact, and wash the cells once with serum-containing media prior to incubation with Nuclear Red™ CCS2. The appropriate incubation time depends on the individual cell type and cell concentration used. Optimize the incubation time for each experiment. It is not necessary to fix cells before staining since Nuclear Red™ CCS2 is cell- permeable.
- Optional: Centrifuge cells at 1000 rpm for 4 minutes and re-suspend cells in 0.5 mL of assay buffer (Component B) or a buffer of your choice.
- Monitor the fluorescence intensity using a flow cytometer with PE-Texas Red channel (Ex/Em = 488/615 nm). Gate the cells of interest, excluding debris.
Product Family
Name | Excitation (nm) | Emission (nm) |
Cell Meter™ Fluorimetric Live Cell Cycle Assay Kit *Green Fluorescence Optimized for Flow Cytometry* | 503 | 527 |
Images

Figure 1. DNA profile in growing Jurkat cells. Jurkat cells were stained with Nuclear Red™ CCS2 for 30 minutes. The fluorescence intensity of Nuclear Red™ CCS2 was measured using ACEA NovoCyte flow cytometer with the channel of PE-Texas Red, the image was generated using Cell Cycle Analysis module of NovoExpress software. In growing Jurkat cells, G0/G1 and G2/M phase histogram peaks are separated by a S-phase distribution.
References
View all 33 references: Citation Explorer
Cell cycle synchronization of Escherichia coli using the stringent response, with fluorescence labeling assays for DNA content and replication
Authors: Ferullo DJ, Cooper DL, Moore HR, Lovett ST.
Journal: Methods (2009): 8
Authors: Ferullo DJ, Cooper DL, Moore HR, Lovett ST.
Journal: Methods (2009): 8
DNA replication, cell cycle progression and the targeted gene repair reaction
Authors: Engstrom JU, Kmiec EB.
Journal: Cell Cycle (2008): 1402
Authors: Engstrom JU, Kmiec EB.
Journal: Cell Cycle (2008): 1402
Morin inhibits the growth of human leukemia HL-60 cells via cell cycle arrest and induction of apoptosis through mitochondria dependent pathway
Authors: Kuo HM, Chang LS, Lin YL, Lu HF, Yang JS, Lee JH, Chung JG.
Journal: Anticancer Res (2007): 395
Authors: Kuo HM, Chang LS, Lin YL, Lu HF, Yang JS, Lee JH, Chung JG.
Journal: Anticancer Res (2007): 395
Direct control of cell cycle gene expression by proto-oncogene product ACTR, and its autoregulation underlies its transforming activity
Authors: Louie MC, Revenko AS, Zou JX, Yao J, Chen HW.
Journal: Mol Cell Biol (2006): 3810
Authors: Louie MC, Revenko AS, Zou JX, Yao J, Chen HW.
Journal: Mol Cell Biol (2006): 3810
Cell cycle markers for live cell analyses
Authors: Easwaran HP, Leonhardt H, Cardoso MC.
Journal: Cell Cycle (2005): 453
Authors: Easwaran HP, Leonhardt H, Cardoso MC.
Journal: Cell Cycle (2005): 453
Dynamic relocalization of hOGG1 during the cell cycle is disrupted in cells harbouring the hOGG1-Cys326 polymorphic variant
Authors: Luna L, Rolseth V, Hildrestr and GA, Otterlei M, Dantzer F, Bjoras M, Seeberg E.
Journal: Nucleic Acids Res (2005): 1813
Authors: Luna L, Rolseth V, Hildrestr and GA, Otterlei M, Dantzer F, Bjoras M, Seeberg E.
Journal: Nucleic Acids Res (2005): 1813
Dynamics of relative chromosome position during the cell cycle
Authors: Essers J, van Cappellen WA, Theil AF, van Drunen E, Jaspers NG, Hoeijmakers JH, Wyman C, Vermeulen W, Kanaar R.
Journal: Mol Biol Cell (2005): 769
Authors: Essers J, van Cappellen WA, Theil AF, van Drunen E, Jaspers NG, Hoeijmakers JH, Wyman C, Vermeulen W, Kanaar R.
Journal: Mol Biol Cell (2005): 769
Description of a flow cytometry approach based on SYBR-14 staining for the assessment of DNA content, cell cycle analysis, and sorting of living normal and neoplastic cells
Authors: Nunez R, Garay N, Villafane C, Bruno A, Lindgren V.
Journal: Exp Mol Pathol (2004): 29
Authors: Nunez R, Garay N, Villafane C, Bruno A, Lindgren V.
Journal: Exp Mol Pathol (2004): 29
Videomicrofluorometry on living cells and discriminant factorial analysis to study cell cycle distributions
Authors: Savatier J, Gbankoto A, Vigo J, Salmon JM.
Journal: J Biol Regul Homeost Agents (2004): 206
Authors: Savatier J, Gbankoto A, Vigo J, Salmon JM.
Journal: J Biol Regul Homeost Agents (2004): 206
Cell cycle regulation of the murine 8-oxoguanine DNA glycosylase (mOGG1): mOGG1 associates with microtubules during interphase and mitosis
Authors: Conlon KA, Zharkov DO, Berrios M.
Journal: DNA Repair (Amst) (2004): 1601
Authors: Conlon KA, Zharkov DO, Berrios M.
Journal: DNA Repair (Amst) (2004): 1601