logo
AAT Bioquest

MycoLight™ Ratiometric Bacterial Membrane Potential Kit *Red/Green Fluorescence*

<em>Bacillus </em><em>subtilis </em>was cultured to log phase and diluted to the concentration of 1 x 10<sup>6</sup> cells per mL in PBS. Cells were then treated with 5 &micro;M CCCP for 20 min and incubated with 1X MycoStain It&trade; Green for 30 min before flow cytometry analysis.
Ordering information
Price
Catalog Number
Unit Size
Quantity
Add to cart
Additional ordering information
Telephone1-800-990-8053
Fax1-800-609-2943
Emailsales@aatbio.com
InternationalSee distributors
Bulk requestInquire
Custom sizeInquire
ShippingStandard overnight for United States, inquire for international
Request quotation
Spectral properties
Excitation (nm)483
Emission (nm)501
Storage, safety and handling
H-phraseH301, H311, H331
Hazard symbolT
Intended useResearch Use Only (RUO)
R-phraseR23, R24, R25
UNSPSC12352200

OverviewpdfSDSpdfProtocol


Excitation (nm)
483
Emission (nm)
501
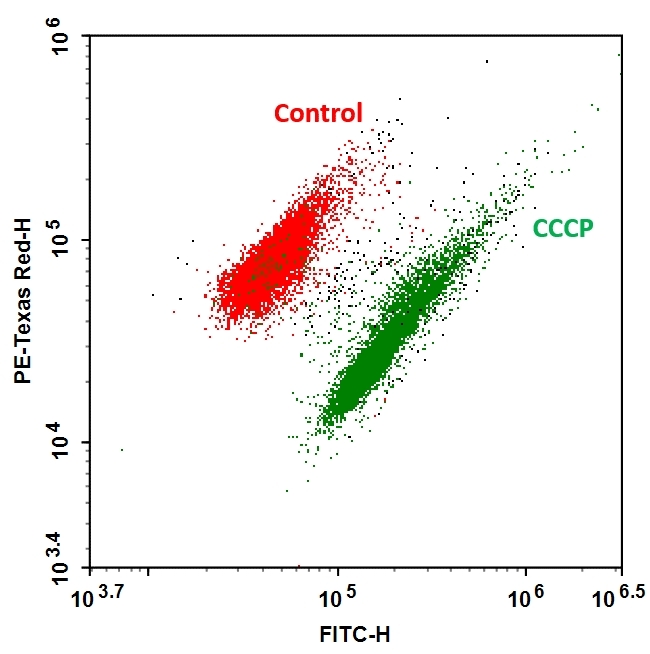
AAT Bioquest's MycoLight™ Ratiometric Bacterial Membrane Potential Kit uses a fluorescent sensor that exhibits green fluorescence in both gram-positive and negative bacterial cells in low concentration, but the fluorescence shifts toward red emission at higher cytosolic concentrations due to the dye molecule aggregation caused by larger membrane potentials. The magnitude of membrane potential varies with different bacterial species. For many gram-positive species, the red/green ratio tend to vary with the intensity of the proton gradient while in many gram-negative bacteria the response of the dye does not appear to be proportional to proton gradient intensity. This kit is designed to assay bacterial membrane potentials when the bacterial concentrations are in the range of 105 " 107 organisms per mL. Stained cells can be monitored fluorimetrically at 510-530 nm (FITC filter) and 600-660 nm (Texas red filter) with excitation at 488 nm, the most common excitation light source.

Platform


Flow cytometer

Excitation488 nm laser
Emission530/30 nm, 610/20 nm filter
Instrument specification(s)FITC, PE-Texas Red channel

Fluorescence microscope

Excitation510/600 nm
Emission530/660 nm
Recommended plateBlack wall/clear bottom
Instrument specification(s)FITC/Texas Red filter sets

Components


Example protocol


AT A GLANCE

Important      Thaw kit components at room temperature and centrifuge briefly before starting your experiment. Note: The Kit has been tested at logarithmically growing cultures of the following bacterial species: Micrococcus luteus, Staphylococcus aureus, S. warnerii, Bacillus cereus, Klebsiella pneumoniae, Escherichia coli, and Salmonella choleraesuis. Note: Many bacteria do not show a proportional response to partial membrane depolarization with MycoStain It™ Green. The response of each bacterial system should be investigated and optimized. Occasionally the MycoStain It™ Green concentration and staining time must be adjusted for optimal detection of membrane potential. The following is the recommended protocol for bacterial staining. The protocol only provides a guideline, should be modified according to the specific needs. Note: Some common buffer components, such as Tween-20, Sodium Azide and thimerosal, can alter membrane potential, and should be avoided. Be sure to test buffer additives for their effect on membrane potential during optimization studies.

SAMPLE EXPERIMENTAL PROTOCOL

  1. Grow bacteria in any appropriate medium. Best results for healthy bacteria are obtained from log-phase cultures. Dilute the bacterial culture to ~ 106 cells per mL in PBS (Component C) or equivalent sterile buffer. Bacteria may be diluted directly from the culture medium without washing. Prepare sufficient suspension to provide 500 µL per test.
  2. Aliquot 500 µl of the bacterial suspension into a flow cytometry tube for each staining experiment to be performed. Prepare two additional tubes for a depolarized control and an unstained control.
  3. Add 10 µl of 500 µM CCCP (Component B) to the depolarized control sample and mix.
  4. Add 5 µl of MycoStain It™ Green (100X) (Component A) to each flow cytometry tube and mix (do not add stain to the unstained control sample). Incubate samples at room temperature for 30 mins. Stained samples can be analyzed after 5 min, but signal intensity continues to increase until ~ 30 mins.
  5. Stained bacteria can be assayed in a flow cytometer equipped with a laser emitting at 488 nm. Fluorescence is collected in the green (fluorescein filter) and red (Texas Red filter) channels. The forward scatter, side scatter, and fluorescence should be collected with logarithmic signal amplification.
  6. Instrument adjustments are especially critical for detecting relatively small particles such as bacteria. Use the unstained control sample to locate bacterial populations in the forward and side scatter channels. Use the side scatter as the parameter for setting the acquisition trigger.
  7. Apply the depolarized control sample after adjusting the flow cytometer as described above. Gate on bacteria using forward versus side scatter and adjust fluorescence photomultiplier tube voltages such that the green and red MFI values are approximately equal. Do not set compensation.
  8. While the relative amount of red and green fluorescence intensity will vary with cell size and aggregation, the ratio of red to green fluorescence intensity can be used as a size-independent indicator of membrane potential. The data can also be processed by gating on bacteria using forward versus side scatter, and analyze gated populations with a dot plot of red versus green fluorescence reporting MFI values as linear values, not as channels.
  9. On a ratiometric histogram, set markers around the peaks of interest and record the mean ratio values. For a dot plot of red versus green fluorescence, set regions around the populations of interest and record red and green mean fluorescence intensity (MFI) values for each. To evaluate the data, divide the red population MFI by the green population MFI.
  10. In the flow cytometer, bacteria are identified solely on the basis of their size and stain ability. It is best to inspect each sample by fluorescence microscopy to confirm that the particles detected are indeed bacteria. 

Spectrum


Open in Advanced Spectrum Viewer
spectrum

Spectral properties

Excitation (nm)483
Emission (nm)501

Images


References


View all 16 references: Citation Explorer
Raman spectroscopic analysis of Lactobacillus rhamnosus GG in response to dehydration reveals DNA conformation changes
Authors: Myintzu Hlaing, M.; Wood, B.; McNaughton, D.; Ying, D.; Augustin, M. A.
Journal: J Biophotonics (2017): 589-597
Inactivation of Cronobacter sakazakii in reconstituted infant formula by combination of thymoquinone and mild heat
Authors: Shi, C.; Jia, Z.; Chen, Y.; Yang, M.; Liu, X.; Sun, Y.; Zheng, Z.; Zhang, X.; Song, K.; Cui, L.; Baloch, A. B.; Xia, X.
Journal: J Appl Microbiol (2015): 1700-6
Antibacterial and antigelatinolytic effects of Satureja hortensis L. essential oil on epithelial cells exposed to Fusobacterium nucleatum
Authors: Zeidan-Chulia, F.; Keskin, M.; Kononen, E.; Uitto, V. J.; Soderling, E.; Moreira, J. C.; Gursoy, U. K.
Journal: J Med Food (2015): 503-6
Fourier transform infra-red spectroscopy and flow cytometric assessment of the antibacterial mechanism of action of aqueous extract of garlic (Allium sativum) against selected probiotic Bifidobacterium strains
Authors: Booyens, J.; Thantsha, M. S.
Journal: BMC Complement Altern Med (2014): 289
Deposition and survival of Escherichia coli O157:H7 on clay minerals in a parallel plate flow system
Authors: Cai, P.; Huang, Q.; Walker, S. L.
Journal: Environ Sci Technol (2013): 1896-903
Observation of injured E. coli population resulting from the application of high-pressure throttling treatments
Authors: De Lamo-Castellvi, S.; Toledo, R.; Frank, J. F.
Journal: J Food Sci (2013): M582-6
Effect of air drying on bacterial viability: A multiparameter viability assessment
Authors: Nocker, A.; Fern and ez, P. S.; Montijn, R.; Schuren, F.
Journal: J Microbiol Methods (2012): 86-95
patients and environment
Authors: Lindback, T.; Rottenberg, M. E.; Roche, S. M.; Rorvik, L. M., The ability to enter into an avirulent viable but non-culturable (VBNC) form is widespread among Listeria monocytogenes isolates from salmon
Journal: Vet Res (2010): 8
Long-term survival of Legionella pneumophila in the viable but nonculturable state after monochloramine treatment
Authors: Alleron, L.; Merlet, N.; Lacombe, C.; Frere, J.
Journal: Curr Microbiol (2008): 497-502
Behaviors of physiologically active bacteria in water environment and chlorine disinfection
Authors: Sawaya, K.; Kaneko, N.; Fukushi, K.; Yaguchi, J.
Journal: Water Sci Technol (2008): 1343-8