Cell Meter™ Fluorimetric Fixed Cell Cycle Assay Kit *Red Fluorescence Optimized for Flow Cytometry*
Ordering information
Price | |
Catalog Number | |
Unit Size | |
Quantity |
Additional ordering information
Telephone | 1-800-990-8053 |
Fax | 1-800-609-2943 |
sales@aatbio.com | |
International | See distributors |
Bulk request | Inquire |
Custom size | Inquire |
Shipping | Standard overnight for United States, inquire for international |
Spectral properties
Excitation (nm) | 537 |
Emission (nm) | 618 |
Storage, safety and handling
H-phrase | H303, H313, H333 |
Hazard symbol | XN |
Intended use | Research Use Only (RUO) |
R-phrase | R20, R21, R22 |
UNSPSC | 12352200 |
Related products
Overview | ![]() ![]() |
Excitation (nm) 537 | Emission (nm) 618 |
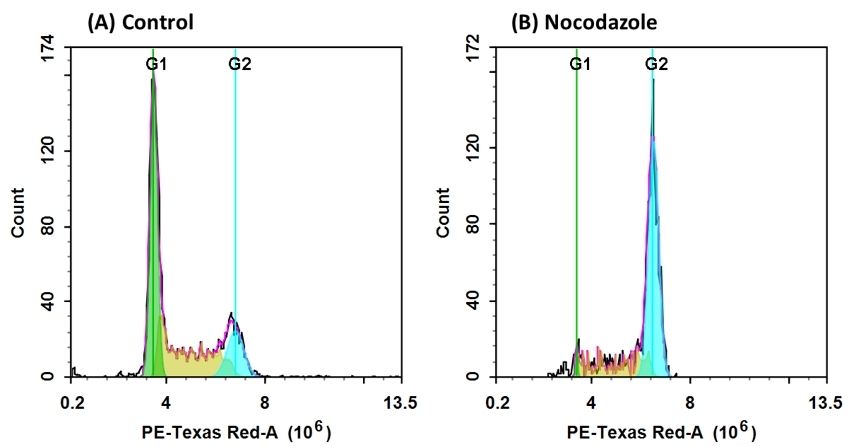
Our Cell Meter™ assay kits are a set of tools for monitoring cell viability and proliferation. There are a variety of parameters that can be used for monitoring cell viability and proliferation. In normal cells, DNA density changes depending on whether the cell is growing, dividing, resting, or performing its ordinary functions. The progression of the cell cycle is controlled by a complex interplay among various cell cycle regulators. These regulators activate transcription factors, which bind to DNA and turn on or off the production of proteins that result in cell division. Any misstep in this regulatory cascade causes abnormal cell proliferation which underlies many pathological conditions, such as tumor formation. Potential applications for live-cell studies are in the determination of cellular DNA content and cell cycle distribution for the detection of variations in growth patterns, for monitoring apoptosis, and for evaluating tumor cell behavior and suppressor gene mechanisms. This particular kit is designed to monitor cell cycle progression and proliferation using Nuclear Red™ CCS1, a cell cycle stain in fixed cells. The dye passes through a permeabilized membrane and intercalates into cellular DNA. The signal intensity of Nuclear Red™ CCS1 is directly proportional to DNA content after RNA is degraded by RNase provided in the kit. The percentage of cells in a given sample that are in G0/G1, S and G2/M phases, as well as the cells in the sub-G1 phase prior to apoptosis can be monitored with a flow cytometer (FL2 channel).
Platform
Flow cytometer
Excitation | 488 nm laser |
Emission | 610/20 nm filter |
Instrument specification(s) | PE-Texas Red channel |
Components
Example protocol
AT A GLANCE
Protocol summary
- Prepare cells with test compounds at a density of 5 × 10⁵ to 1 × 10⁶ cells/mL
- Fix cells with 70% Ethanol
- Add 5 µL of 100X Nuclear Red™ CCS1 and 5 µL of RNase A into 0.5 mL of cells solution
- Incubate at room temperature for 30 - 60 minutes
- Analyze cells using a flow cytometer with FL2 channel
Important notes
Thaw all the components at room temperature before starting the experiment.
SAMPLE EXPERIMENTAL PROTOCOL
- Treat cells with test compounds for a desired period of time to induce apoptosis or other cell cycle functions.
- For each sample, prepare cells in 0.5 mL PBS at a density of 5 × 10⁵ to 1 × 10⁶ cells/mL.
For Adherent Cells: The cells are trypsinized, suspended in 10% FBS medium, centrifuged (1000 rpm, 5 min), and the pellets are resuspended in PBS.
For Suspension Cells: The cells are centrifuged (1000 rpm, 5 min), and the pellets suspended in PBS (1 mL). Note: Each cell line should be evaluated on an individual basis to determine the optimal cell density for apoptosis induction.
Fix the cells with 70% Ethanol:
- Pipet 0.5 mL cell suspension into 1.2 mL absolute Ethanol (final concentration approx. 70%).
- Incubate cells on ice for at least 2 hours (or overnight at -20°C). Cells can be stored at -20°C for up to 2 years before staining. Note: Ethanol is commonly used for fixation after cell surface antigens were stained with monoclonal antibodies, while methanol is commonly used for fixation after intracellular antigens were stained with monoclonal antibodies. In this procedure whole cells are fixed and analyzed. Because the entire cell mass is still present, the use of RNase is typically included to eliminate any double-stranded RNA. Despite the fact that whole cells are being analyzed, attempts to detect some intracellular antigens in conjunction with DNA may fail because the proteins leak out of the permeabilized cell (e.g. green fluorescent protein). In these cases a brief pre-fixation (10 minutes at 4 - 6°C) with 1% paraformaldehyde in PBS before the alcohol fixation will help retain the proteins in the cell.
Stain the cells with Nuclear Red™ CCS1:
- Pellet the cells at 1000 rpm for 5 minutes and wash cells at least once with cold PBS.
- Suspend the pellet in 0.5 mL of Assay buffer (Component C).
- Add 5 µL of 100X Nuclear Red™ CCS1 (Component A) and 5 µL of 100X RNase A (Component B).
- Incubate the cells at room temperature for 30 to 60 minutes. Note: The appropriate incubation time depends on the individual cell type and cell concentration used. Optimize the incubation time for each experiment.
- Optional: Centrifuge the cells at 1000 rpm for 5 minutes, and re-suspend cells in 0.5 mL of assay buffer (Component B) or buffer of your choice.
- Monitor the fluorescence intensity with a flow cytometer using FL2 channel (Ex/Em = 490/620 nm). Gate on the cells of interest, excluding debris.
Product Family
Images

Figure 1. DNA profile in growing and nocodazole treated Jurkat cells. Jurkat cells were treated without (A) or with 100 ng/ml Nocodazole (B) in 37 °C, 5% CO2 incubator for 24 hours before fixed with 70% ethanol, dye loaded with Nuclear Red™ CCS1 and treated with RNase A were loaded for 30 minutes. The fluorescence intensity of Nuclear Red™ CCS1 was measured with ACEA NovoCyte flow cytometer with the channel of PE-Texas Red. In growing Jurkat cells (A), nuclear stained with Nuclear Red™ CCS1 shows G1, S, and G2 phases (A). In nocodazole treated G2 arrested cells (B), frequency of G2 cells increased dramatically and G1, S phase frequency decreased significantly.
References
View all 33 references: Citation Explorer
Cell cycle synchronization of Escherichia coli using the stringent response, with fluorescence labeling assays for DNA content and replication
Authors: Ferullo DJ, Cooper DL, Moore HR, Lovett ST.
Journal: Methods (2009): 8
Authors: Ferullo DJ, Cooper DL, Moore HR, Lovett ST.
Journal: Methods (2009): 8
DNA replication, cell cycle progression and the targeted gene repair reaction
Authors: Engstrom JU, Kmiec EB.
Journal: Cell Cycle (2008): 1402
Authors: Engstrom JU, Kmiec EB.
Journal: Cell Cycle (2008): 1402
Morin inhibits the growth of human leukemia HL-60 cells via cell cycle arrest and induction of apoptosis through mitochondria dependent pathway
Authors: Kuo HM, Chang LS, Lin YL, Lu HF, Yang JS, Lee JH, Chung JG.
Journal: Anticancer Res (2007): 395
Authors: Kuo HM, Chang LS, Lin YL, Lu HF, Yang JS, Lee JH, Chung JG.
Journal: Anticancer Res (2007): 395
Direct control of cell cycle gene expression by proto-oncogene product ACTR, and its autoregulation underlies its transforming activity
Authors: Louie MC, Revenko AS, Zou JX, Yao J, Chen HW.
Journal: Mol Cell Biol (2006): 3810
Authors: Louie MC, Revenko AS, Zou JX, Yao J, Chen HW.
Journal: Mol Cell Biol (2006): 3810
Cell cycle markers for live cell analyses
Authors: Easwaran HP, Leonhardt H, Cardoso MC.
Journal: Cell Cycle (2005): 453
Authors: Easwaran HP, Leonhardt H, Cardoso MC.
Journal: Cell Cycle (2005): 453
Dynamic relocalization of hOGG1 during the cell cycle is disrupted in cells harbouring the hOGG1-Cys326 polymorphic variant
Authors: Luna L, Rolseth V, Hildrestr and GA, Otterlei M, Dantzer F, Bjoras M, Seeberg E.
Journal: Nucleic Acids Res (2005): 1813
Authors: Luna L, Rolseth V, Hildrestr and GA, Otterlei M, Dantzer F, Bjoras M, Seeberg E.
Journal: Nucleic Acids Res (2005): 1813
Dynamics of relative chromosome position during the cell cycle
Authors: Essers J, van Cappellen WA, Theil AF, van Drunen E, Jaspers NG, Hoeijmakers JH, Wyman C, Vermeulen W, Kanaar R.
Journal: Mol Biol Cell (2005): 769
Authors: Essers J, van Cappellen WA, Theil AF, van Drunen E, Jaspers NG, Hoeijmakers JH, Wyman C, Vermeulen W, Kanaar R.
Journal: Mol Biol Cell (2005): 769
Description of a flow cytometry approach based on SYBR-14 staining for the assessment of DNA content, cell cycle analysis, and sorting of living normal and neoplastic cells
Authors: Nunez R, Garay N, Villafane C, Bruno A, Lindgren V.
Journal: Exp Mol Pathol (2004): 29
Authors: Nunez R, Garay N, Villafane C, Bruno A, Lindgren V.
Journal: Exp Mol Pathol (2004): 29
Videomicrofluorometry on living cells and discriminant factorial analysis to study cell cycle distributions
Authors: Savatier J, Gbankoto A, Vigo J, Salmon JM.
Journal: J Biol Regul Homeost Agents (2004): 206
Authors: Savatier J, Gbankoto A, Vigo J, Salmon JM.
Journal: J Biol Regul Homeost Agents (2004): 206
Cell cycle regulation of the murine 8-oxoguanine DNA glycosylase (mOGG1): mOGG1 associates with microtubules during interphase and mitosis
Authors: Conlon KA, Zharkov DO, Berrios M.
Journal: DNA Repair (Amst) (2004): 1601
Authors: Conlon KA, Zharkov DO, Berrios M.
Journal: DNA Repair (Amst) (2004): 1601