
Products
Services
Resources
Selection Guides
About
LysoBrite™ Red
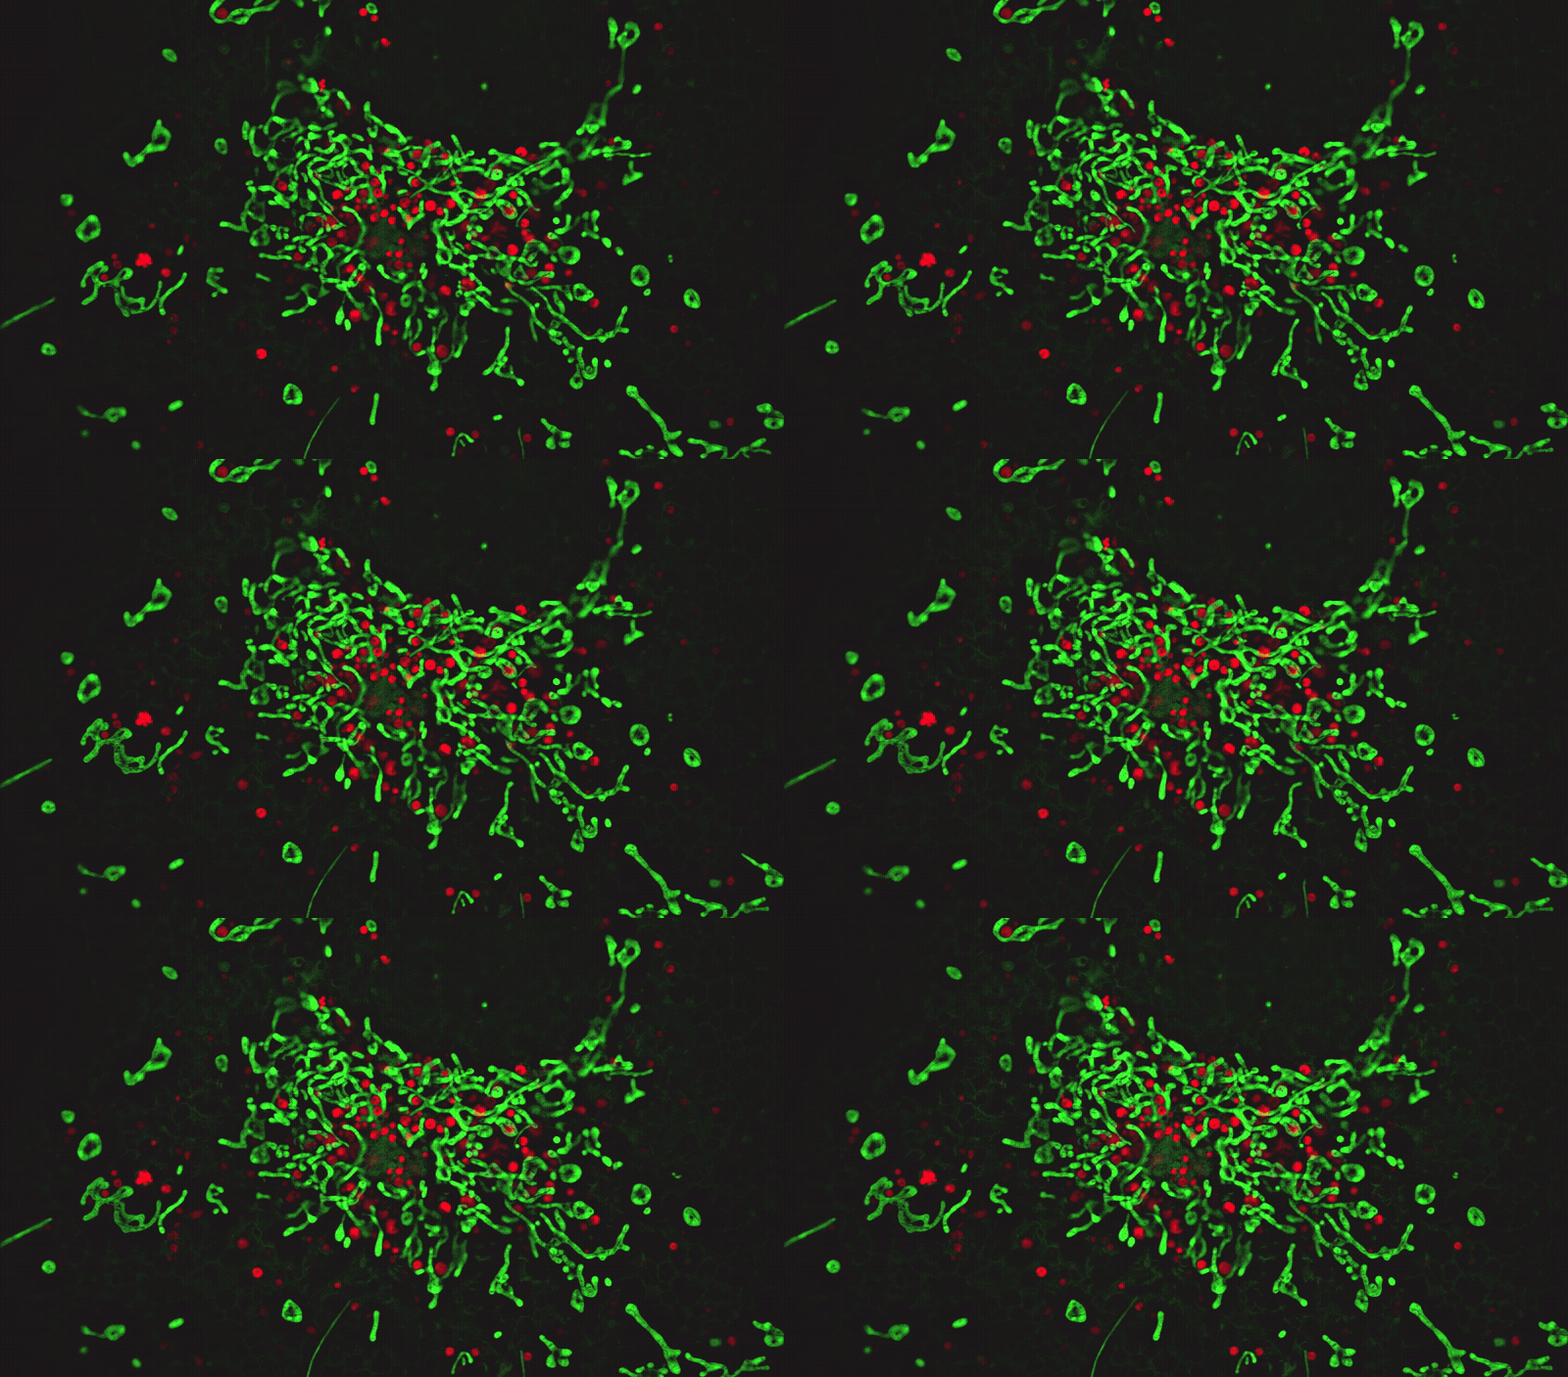
Lysosomes are cellular organelles which contain acid hydrolase enzymes to break up waste materials and cellular debris. Lysosomes digest excess or worn-out organelles, food particles, and engulfed viruses or bacteria. The membrane around a lysosome allows the digestive enzymes to work at pH 4.5. The interior of the lysosomes is acidic (pH 4.5-4.8) compared to the slightly alkaline cytosol (pH 7.2). The lysosome maintains this pH differential by pumping protons from the cytosol across the membrane via proton pumps and chloride ion channels. LysoBrite™ Red selectively accumulates in lysosomes probably via the lysosome pH gradient. The lysotropic indicator is a hydrophobic compound that easily permeates intact live cells, and trapped in lysosomes after it gets into cells. Its fluorescence is significantly enhanced upon entering lysosomes. This key feature significantly reduces its staining background and makes it useful for a variety of studies, including cell adhesion, chemotaxis, multidrug resistance, cell viability, apoptosis and cytotoxicity. It is suitable for proliferating and non-proliferating cells, and can be used for both suspension and adherent cells. LysoBrite™ dyes significantly outperform the equivalent LysoTracker ™dyes (from Invitrogen). LysoBrite™ dyes can stay in live cells for more than a week with very minimal cell toxicity while the LysoTracker dyes can only be used for a few hours. LysoBrite™ dyes can survive a few generations of cell division. In addition, LysoBrite™ dyes are much more photostable than the LysoTracker dyes.


| Catalog | Size | Price | Quantity |
|---|---|---|---|
| 22645 | 500 Tests | Price |
Physical properties
| Molecular weight | 698.94 |
| Solvent | DMSO |
Spectral properties
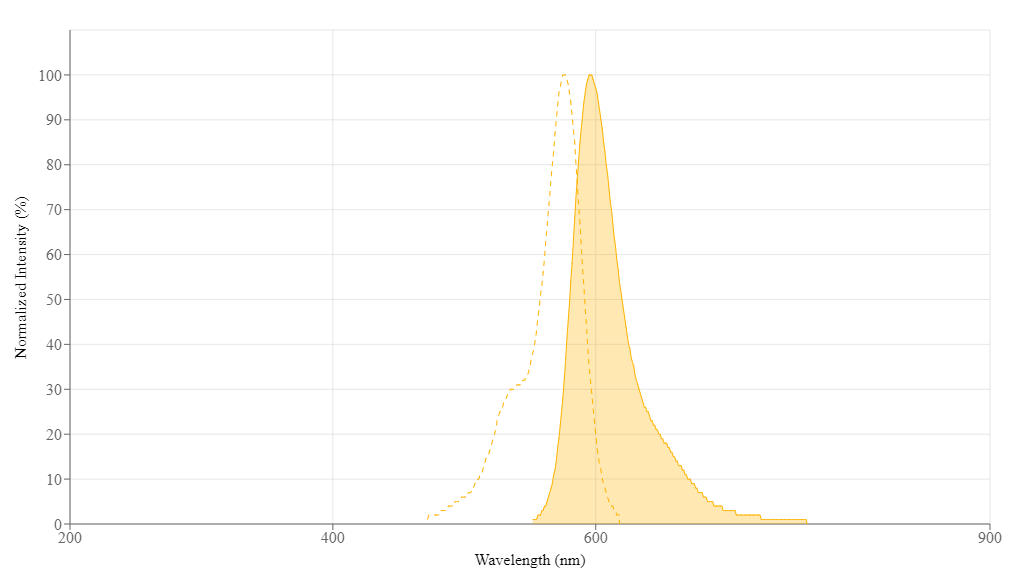
| Excitation (nm) | 576 |
| Emission (nm) | 596 |
Usage and storage
| Intended use | Research Use Only (RUO) |
| Storage | Freeze (< -15 °C); Minimize light exposure |
Instrument settings
| Flow cytometer | |
| Excitation | 532/561 nm laser |
| Emission | 585/40 nm filter |
| Fluorescence microscope | |
| Excitation | TRITC filter set |
| Emission | TRITC filter set |
| Recommended plate | Black wall/clear bottom |
Contact us
| Telephone | |
| Fax | |
| sales@aatbio.com | |
| International | See distributors |
| Bulk request | Inquire |
| Custom size | Inquire |
| Technical support | Contact us |
| Request quotation | Request |
| Purchase order | Send to sales@aatbio.com |
| Shipping | Standard overnight for United States, inquire for international |
Page updated on October 20, 2026