Comprehensive Guide to Cell Health Assays in Flow Cytometry: A Multidimensional Exploration
In this issue
New Uses for LAMP (Loop-Mediated Isothermal Amplification)
Investigating Intercellular Channels: Focus on Gap Junctions
Unlocking the Potential of 3D Cell Culture: A Guide to Assay Optimization
Comprehensive Guide to Cell Health Assays in Flow Cytometry: A Multidimensional Exploration
AssayWise Letters 2023, Vol. 12

Abstract
Flow cytometry stands as an invaluable tool in biomedical research, facilitating nuanced cell health assessments across a spectrum of assays. This precise evaluation of cellular vitality, viability, apoptosis, and stress responses has profound implications in diverse scientific domains, encompassing drug development, immunology, and cancer research. In this comprehensive guide, we not only emphasize the pivotal role of cell health assays in flow cytometry but also embark on an in-depth exploration of best practices, supported by illustrative examples. Our central focus is on enhancing robustness, reproducibility, and accuracy to empower researchers in optimizing their experimental protocols and deriving meaningful insights from cell health assessments.
Introduction
The contemporary landscape of biomedical research is characterized by a fundamental pursuit: understanding the health of individual cells. Flow cytometry has revolutionized our capacity to delve into this pursuit by enabling comprehensive cell health assessments. This guide delves deep into the crucial role of cell health assays within the realm of flow cytometry. We navigate the intricate nuances and best practices, anchored by illustrative examples, to assist researchers in refining their experimental methodologies.
Unraveling the Essence of Cell Health Assessment
Cell health assessments serve as the bedrock of biomedical research, allowing us to explore the intricate workings of cells and unearth insights that transcend cellular boundaries. Among the various methodologies, flow cytometry emerges as the linchpin unlocking the secrets of cell health. This scientific analysis provides a holistic perspective on cell vitality and well-being, rendering it indispensable in numerous fields, including drug discovery, immunology, cancer research, neurodegenerative disease studies, and microbiology.
Viability Assessment
The foundation of cell health assessments lies in the discrimination between living and deceased cells. This critical distinction is achieved through the application of specialized dyes, such as propidium iodide (PI), calcein AM, and 7-AAD. These dyes act as indicators of cell survival, highlighting the integrity of the cell membrane and intracellular structures. In drug discovery, for instance, viability assessment plays a pivotal role in evaluating the cytotoxic effects of novel compounds. Researchers employ these dyes to gauge how various pharmaceutical agents impact cell health. A decrease in cell viability, as indicated by increased staining with dyes like PI or 7-AAD, hints at potential toxicity of the tested compounds. This insight guides the selection of promising drug candidates while safeguarding the well-being of healthy cells.Apoptosis Profiling

The detection of binding activity of FITC-Annexin V to phosphatidylserine in Jurkat cells using Cell Meter™ FITC-Annexin V Binding Apoptosis Assay Kit. Jurkat cells were treated without (Blue) or with 1 μM staurosporine (Red) in a 37ºC, 5% CO2 incubator for 4-5 hours, and then dye loaded for 30 minutes. The fluorescence intensity of FITC-Annexin V was measured with a FACSCalibur (Becton Dickinson, San Jose, CA) flow cytometer using the FL1 channel.
Resources for Apoptosis
Cell Cycle Analysis
Understanding how cells progress through the different phases of the cell cycle—G1, S, G2, and M—is pivotal for comprehending cell proliferation. DNA-binding dyes, including propidium iodide (PI), are deployed to illuminate the nuances of cell cycle dynamics. In cancer research, cell cycle analysis holds paramount importance. Chemotherapeutic agents designed to target rapidly dividing cancer cells often impact cell cycle progression. By employing PI staining, researchers can discern alterations in the distribution of cells across different cell cycle phases, providing critical insights into the efficacy and mechanisms of these treatments. For example, an increase in cells arrested in the G2 phase may indicate that a drug disrupts cell division, potentially inhibiting cancer growth.
DNA profile in growing and nocodazole treated Jurkat cells. Jurkat cells were treated without (A) or with 100 ng/mL Nocodazole (B) in a 37 °C, 5% CO2 incubator for 24 hours, then incubated with Nuclear Green™ LCS1 for 30 minutes. The fluorescence intensity of Nuclear Green™ LCS1 was measured with an ACEA NovoCyte flow cytometer in the FITC channel. In growing Jurkat cells (A), nuclear staining with Nuclear Green™ LCS1 shows G1, S, and G2 phases. In Nocodazole treated G2 arrested cells (B), the frequency of G2 cells increased dramatically, while G1 and S phase-frequency decreased significantly.
Mitochondrial Health Assessment
Mitochondria, the cellular powerhouses, play a pivotal role in overall cell health. Preserving the integrity and function of mitochondria is essential for the cell's energy production and overall well-being. Mitochondrial membrane potential (ΔΨm) assays, utilizing dyes such as JC-10™, JC-1, TMRE and TMRM, offer a window into mitochondrial function. In the field of neurodegenerative diseases, monitoring ΔΨm changes provides valuable insights into mitochondrial dysfunction, a common feature of conditions like Alzheimer's disease. For instance, in Alzheimer's research, alterations in mitochondrial membrane potential can signify early cellular stress, which may precede neuronal damage. By using JC-10™ staining, researchers can identify potential targets for therapeutic intervention aimed at preserving mitochondrial health.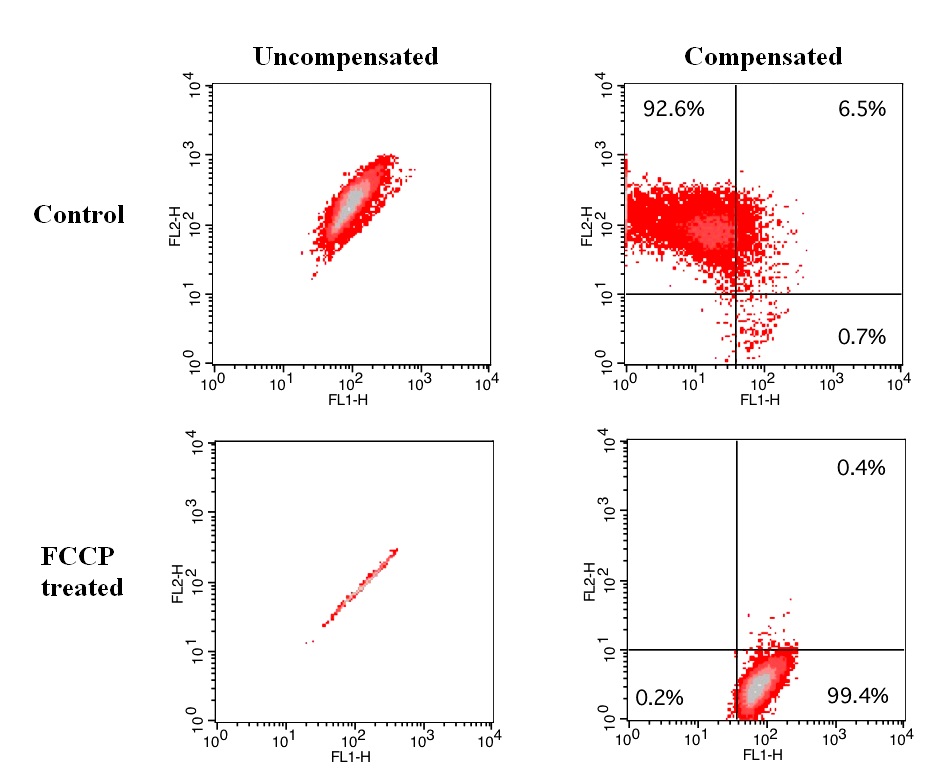
Effect of FCCP induced mitochondria membrane potential change in Jurkat cells. Jurkat cells were dye loaded with JC-10 dye working solution along with DMSO (Top) or 5 µM FCCP (Low) for 10 minutes. The fluorescence intensities for both J-aggregates and monomeric forms of JC-10 were measured with a FACSCalibur (Becton Dickinson) flow cytometer using FL1 and FL2 channels. Uncompensated data (left column) were compared with compensated data (right column).
Oxidative Stress Measurement

Detection of hydrogen peroxide in Jurkat cells using Cell Meter™ Intracellular Fluorimetric Hydrogen Peroxide Assay Kit (Cat#: 11506). Jurkat cells were stained with OxiVision™ Green peroxide sensor for 30 minutes and treated with 100 µM hydrogen peroxide at 37 °C for 90 minutes. Cells stained with OxiVision™ Green peroxide sensor but without hydrogen peroxide treatment were used as control.
Resources for Oxidative Stress
- Selecting the right ROS probe
- Detection of Reactive Oxygen Species (ROS) Using Multicolor ROS Brite™ Reagents
- Detection of Reactive Oxygen Species (ROS) in Live Cell Mitochondria
Best Practices in Cell Health Assays for Flow Cytometry
Ensuring the reliability and reproducibility of cell health assessments through flow cytometry necessitates a multifaceted approach:
- Sample Preparation: Gentle sample handling emerges as the foundational layer to prevent cellular stress. Optimizing cell concentration is essential, and the meticulous exclusion of dead cells is pivotal. For instance, in stem cell research, maintaining the pluripotent state and integrity of stem cells during sample preparation is critical to the success of downstream experiments.
- Appropriate Assay Selection: The selection of an assay should harmonize with the research question at hand and the biological context. In drug development, the judicious choice of a viability assay can spell the difference between the advancement or abandonment of therapeutic compounds.
- Control Panels: A comprehensive control panel emerges as the keystone for precise data interpretation. This panel includes unstained cells, single-stained cells, and untreated cells—serving as North Stars for accurate data interpretation. In immunology, these controls ensure that observed changes in cell health align with vaccine-induced immune responses.
- Staining Optimization: The careful titration of staining reagents is a meticulous process that determines the optimal concentration, optimizing signal-to-noise ratios. In cancer research, the accurate measurement of cell cycle phases hinges on precise staining optimization, allowing the detection of subtle changes in cell cycle progression.
- Incubation Conditions: Adherence to recommended incubation conditions—time, temperature, and humidity—is paramount for staining procedures. Consistency ensures reproducibility, especially in studies that explore the effects of temperature on cell health, such as in virology research.
- Data Acquisition: The acquisition of a sufficient number of events is the bedrock for achieving statistical significance. Proper flow cytometer settings, including laser and detector configurations, are vital for the accurate acquisition of data. In neuroscience, meticulous data acquisition ensures that subtle changes in mitochondrial membrane potential are accurately detected in neuronal cells.
- Gating Strategy: The construction of a robust gating strategy, guided by controls and based on scatter properties and fluorescence intensity, is critical to focus on the cell population of interest. In hematological research, gating is essential to differentiate between normal and abnormal blood cell populations.
- Instrument Calibration: Regular calibration and maintenance of the flow cytometer are prerequisites for data accuracy. This entails meticulous checks on lasers, detectors, and fluidics. In microbial ecology studies, maintaining precise instrument calibration ensures the detection of subtle shifts in ROS levels in microbial populations exposed to environmental stressors.
- Data Analysis: Flow cytometry analysis software becomes the fulcrum for extracting pertinent parameters, such as viability percentages, cell cycle phases, or mitochondrial membrane potential. In the context of autoimmune diseases, precise data analysis aids in understanding the impact of immunosuppressive therapies on immune cell health.
- Validation: Results should be validated using complementary assays or biological controls, ensuring alignment with expected outcomes based on experimental design. In pharmacological research, validating cell health assay results with additional viability assays confirms the reliability of drug screening data.
- Documentation and Record Keeping: Comprehensive records encompassing protocols, instrument settings, and data files are the bulwark of data reproducibility. In regenerative medicine, meticulous record-keeping ensures the reproducibility of stem cell viability assessments.
Conclusion
Cell health assays, when strategically harnessed within the framework of flow cytometry, ascend as indispensable tools for unraveling the intricacies of cellular well-being. The adherence to best practices spanning from sample preparation to data analysis fosters the generation of accurate and reliable results. Researchers, armed with this knowledge, navigate the labyrinthine terrain of cell health assessment, unlocking deeper insights into the dynamics of cellular processes in health and disease. Cell health assays in flow cytometry emerge not merely as laboratory techniques but as the quintessential instruments that empower scientists to illuminate the mysteries of cellular dynamics in the expansive domain of biomedical research. The journey of biomedical discovery is, indeed, a voyage into the very essence of life—cell by cell, insight by insight.
References
- Alberts, Bruce, et al. Molecular Biology of the Cell. 6th ed., Garland Science, 2014.
- Gorman, Jason. "Recent Developments in Flow Cytometry." Trends in Cell Biology, vol. 28, no. 5, 2018, pp. 372-381.
- Johnson, Alice, and Charles Brown. Cell Biology Handbook. 3rd ed., Academic Press, 2019.
- Johnson, Emily R., and David A. Smith. "Flow Cytometry in Cancer Research: Recent Advances and Future Perspectives." Cancer Letters, vol. 377, no. 1, 2016, pp. 1-8.
- Li, Yuan, et al. "Quantitative Assessment of Cellular Viability by Flow Cytometry." Current Protocols in Cytometry, vol. 75, no. 1, 2016, pp. 9.44.1-9.44.18.
- Mitochondrial Research Society. "Mitochondrial Function Assessment: Mitochondrial Membrane Potential (ΔΨm)." Mitochondrial Function in Health and Disease, https://www.mitochondrial-research.org/mitochondrial-membrane-potential-deltapsim.
- National Institute of Health. "Flow Cytometry Techniques in Biomedical Research." NIH Research Insights, 2021, https://www.nihresearchinsights.org/flow-cytometry-techniques.
- Sies, Helmut. "Oxidative Stress: A Concept in Redox Biology and Medicine." Redox Biology, vol. 4, 2015, pp. 180-183.
- Smith, John. "Advances in Flow Cytometry Applications." Journal of Biomedical Research, vol. 45, no. 2, 2020, pp. 123-145.
Product Ordering Information
Table 1. Calcein-based cell viability probes and assay kits.
| Product ▲ ▼ | Unit Size ▲ ▼ | Cat No. ▲ ▼ |
| Calcein Blue, AM *CAS 168482-84-6* | 1 mg | 22007 |
| Calcein Blue *CAS 54375-47-2* | 25 mg | 22006 |
| CytoCalcein™ Violet 450 *Excited at 405 nm* | 1 mg | 22012 |
| Calcein UltraBlue™ AM | 10x50 µg | 21908 |
| Calcein UltraBlue™ sodium salt | 1 mg | 21909 |
| CytoCalcein™ Violet 500 *Excited at 405 nm* | 1 mg | 22013 |
| CytoCalcein™ Violet 660, sodium salt *Excited at 405 nm* | 1 mg | 21903 |
| CytoCalcein™ Violet 660 *Excited at 405 nm* | 1 mg | 21904 |
| Calcein UltraGreen™ AM | 10x50 µg | 21905 |
| Calcein, AM *CAS 148504-34-1* | 1 mg | 22002 |
Table 2. Fixable viability dyes for live/dead cell analysis during flow cytometry
| Product ▲ ▼ | Ex (nm) ▲ ▼ | Em (nm) ▲ ▼ | Spectrum ▲ ▼ | Unit Size ▲ ▼ | Cat No. ▲ ▼ |
| Cell Meter™ VX450 fixable viability dye | 406 | 445 | 200 Tests | 22540 | |
| Cell Meter™ VX500 fixable viability dye | 433 | 498 | 200 Tests | 22542 | |
| Cell Meter™ BX520 fixable viability dye | 491 | 516 | 200 Tests | 22510 | |
| Cell Meter™ BX590 fixable viability dye | 492 | 579 | 200 Tests | 22514 | |
| Cell Meter™ BX650 fixable viability dye | 518 | 654 | 200 Tests | 22520 | |
| Cell Meter™ RX660 fixable viability dye | 649 | 664 | 200 Tests | 22530 | |
| Cell Meter™ RX700 fixable viability dye | 690 | 713 | 200 Tests | 22532 | |
| Cell Meter™ RX780 fixable viability dye | 629 | 767 | 200 Tests | 22536 | |
| Cell Meter™ IX830 fixable viability dye | 811 | 822 | 200 Tests | 22529 | |
| ReadiView™ Green/Red Viability Stain | 100 Tests | 22762 |
Table 3. Live or Dead™ Fixable Dead Cell Staining kits for live/dead cell analysis during flow cytometry
| Kit ▲ ▼ | Laser (nm) ▲ ▼ | Ex/Em (nm) ▲ ▼ | Multiplex ▲ ▼ | Fixable ▲ ▼ | Unit Size ▲ ▼ | Cat No. ▲ ▼ |
| Live or Dead™ Fixable Dead Cell Staining Kit *Blue Fluorescence* | UV (350 nm) | 353/442 | Yes | Yes | 200 Tests | 22600 |
| Live or Dead™ Fixable Dead Cell Staining Kit *Blue Fluorescence with 405 nm Excitation* | Violet (405 nm) | 410/450 | Yes | Yes | 200 Tests | 22500 |
| Live or Dead™ Fixable Dead Cell Staining Kit *Green Fluorescence with 405 nm Excitation* | Violet (405 nm) | 408/512 | Yes | Yes | 200 Tests | 22501 |
| Live or Dead™ Fixable Dead Cell Staining Kit *Green Fluorescence* | Blue (488 nm) | 498/521 | Yes | Yes | 200 Tests | 22601 |
| Live or Dead™ Fixable Dead Cell Staining Kit *Orange Fluorescence with 405 nm Excitation* | Violet (405 nm) | 398/550 | Yes | Yes | 200 Tests | 22502 |
| Live or Dead™ Fixable Dead Cell Staining Kit *Orange Fluorescence* | Green/Yellow (532/561 nm) | 547/573 | Yes | Yes | 200 Tests | 22602 |
| Live or Dead™ Fixable Dead Cell Staining Kit *Red Fluorescence* | Yellow (561 nm) | 583/603 | Yes | Yes | 200 Tests | 22603 |
| Live or Dead™ Fixable Dead Cell Staining Kit *Red Fluorescence Optimized for Flow Cytometry* | Blue/Green (488/532 nm) | 523/617 | Yes | Yes | 200 Tests | 22599 |
| Live or Dead™ Fixable Dead Cell Staining Kit *Red Fluorescence Optimized for Flow Cytometry* | Red (635 nm) | 649/660 | Yes | Yes | 200 Tests | 22604 |
| Live or Dead™ Fixable Dead Cell Staining Kit *Red Fluorescence Optimized for Flow Cytometry* | Red (635 nm) | 749/775 | Yes | Yes | 200 Tests | 22605 |
Table 4. Cell Meter™ Annexin V Binding Apoptosis Assay Selection Guide
| Annexin V Conjugate ▲ ▼ | Dead Cell Stain ▲ ▼ | Annexin V Conjugate Ex/Em ▲ ▼ | Dead Cell stain Ex/Em ▲ ▼ | Unit Size ▲ ▼ | Cat No. ▲ ▼ |
| Annexin V-iFluor® 488 | PI | 490/ 520 nm | 534/617 nm | 100 Tests | 22824 |
| Annexin V-iFluor® 555 | None | 554/578 nm | *** | 100 Tests | 22825 |
| Annexin V-iFluor® 594 | None | 590/610 nm | *** | 100 Tests | 22826 |
| Annexin V-iFluor® 647 | None | 650/668 nm | *** | 100 Tests | 22827 |
| Annexin V-mFluor™ Violet 450 | PI | 405/450 nm | 534/617 nm | 100 Tests | 22828 |
| Annexin V-mFluor™ Violet 500 | PI | 414/508 nm | 534/617 nm | 100 Tests | 22829 |
| Annexin V-mFluor™ Violet 550 | PI | 424/560 nm | 534/617 nm | 100 Tests | 22830 |
| Annexin V-APC | PI | 651/662 nm | 534/617 nm | 100 Tests | 22837 |
| Annexin V-PE | Nuclear Red™ DCS1 | 565/575 nm | 631/651 nm | 100 Tests | 22838 |
| Annexin V-FITC | PI | 490/520 nm | 534/617 nm | 100 Tests | 22839 |
Table 5. CytoTell™ and CFSE cell proliferation dyes for flow cytomtery
| Product Name ▲ ▼ | Excitation Source (nm) ▲ ▼ | Ex (nm) ▲ ▼ | Em (nm) ▲ ▼ | Unit Size ▲ ▼ | Cat No. ▲ ▼ |
| CytoTell™ Blue | Violet Laser (405 nm) | 410 | 445 | 500 Tests | 22251 |
| CytoTell™ Violet 500 | Violet Laser (405 nm) | 415 | 499 | 500 Tests | 22248 |
| CFSE [5-(and 6)-Carboxyfluorescein diacetate, succinimidyl ester] | Blue Laser (488 nm) | 498 | 517 | 25 mg | 22022 |
| ReadiUse™ CFSE [5-(and 6)-Carboxyfluorescein diacetate, succinimidyl ester] | Blue Laser (488 nm) | 498 | 517 | 5 x 500 µg | 22028 |
| CytoTell™ Green | Blue Laser (488 nm) | 510 | 525 | 500 Tests | 22253 |
| CytoTell™ UltraGreen | Blue Laser (488 nm) | 492 | 519 | 500 Tests | 22240 |
| CytoTell™ Orange | Green Laser (531 nm) | 541 | 560 | 500 Tests | 22257 |
| CytoTell™ Red 590 | Green Laser (531 nm) | 560 | 574 | 500 Tests | 22261 |
| CytoTell™ Red 650 | Red Laser (633/647 nm) | 626 | 643 | 500 Tests | 22255 |
| CytoTell™ Blue | Violet Laser (405 nm) | 410 | 445 | 2 x 500 Tests | 22252 |
Table 6. Live and fixed cell cycle assays for flow cytometry
| Product Name ▲ ▼ | Excitation Source (nm) ▲ ▼ | Ex (nm) ▲ ▼ | Em (nm) ▲ ▼ | Unit Size ▲ ▼ | Cat No. ▲ ▼ |
| Cell Meter™ Fluorimetric Live Cell Cycle Assay Kit *Optimized for 405 nm Violet Laser Excitation* | Violet Laser (405 nm) | 401 | 460 | 100 Tests | 22845 |
| Cell Meter™ Fluorimetric Live Cell Cycle Assay Kit *Green Fluorescence Optimized for Flow Cytometry* | Blue Laser (488 nm) | 503 | 527 | 100 Tests | 22841 |
| Cell Meter™ Fluorimetric Live Cell Cycle Assay Kit *Red Fluorescence Optimized for Flow Cytometry* | Blue Laser (488 nm) | 488 | 615 | 100 Tests | 22860 |
| Cell Meter™ Fluorimetric Fixed Cell Cycle Assay Kit *Red Fluorescence Optimized for Flow Cytometry* | Blue/Green Laser (488/532 nm) | 537 | 682 | 100 Tests | 22842 |
Table 7. Reagents and assays for monitoring mitochondrial membrane potential during flow cytometry
| Product Name ▲ ▼ | Excitation Source (nm) ▲ ▼ | Ex (nm) ▲ ▼ | Em (nm) ▲ ▼ | Unit Size ▲ ▼ | Cat No. ▲ ▼ |
| JC-1 | Blue Laser (488 nm) | 515 | 530 | 5 mg | 22200 |
| JC-1 | Blue Laser (488 nm) | 515 | 530 | 50 mg | 22201 |
| JC-10™ | Blue Laser (488 nm) | 508 | 524 | 50 mg | 22201 |
| TMRE | Green Laser (532 nm) | 552 | 574 | 25 mg | 22220 |
| TMRM | Green Laser (532 nm) | 552 | 574 | 25 mg | 22221 |
| Cell Meter™ JC-10 Mitochondrion Membrane Potential Assay Kit *Optimized for Flow Cytometry Assays* | Blue Laser (488 nm) | 488 | 530, 575 nm | 100 Tests | 22801 |
| Cell Meter™ Mitochondrion Membrane Potential Assay Kit *Orange Fluorescence Optimized for Flow Cytometry* | Blue/Green Laser (488/532 nm) | 540 | 590 | 100 Tests | 22804 |
| Cell Meter™ Mitochondrion Membrane Potential Assay Kit *Red Fluorescence Optimized for Flow Cytometry* | Red Laser (640 nm) | 640 | 660 | 100 Tests | 22806 |
| Cell Meter™ NIR Mitochondrion Membrane Potential Assay Kit *Optimized for Flow Cytometry* | Red Laser (633-640 nm) | 635 | 660 | 100 Tests | 22806 |